View methods side by side.
Choose up to four methods. Add them using the search and share the comparison by copying its link.
| Criterion | 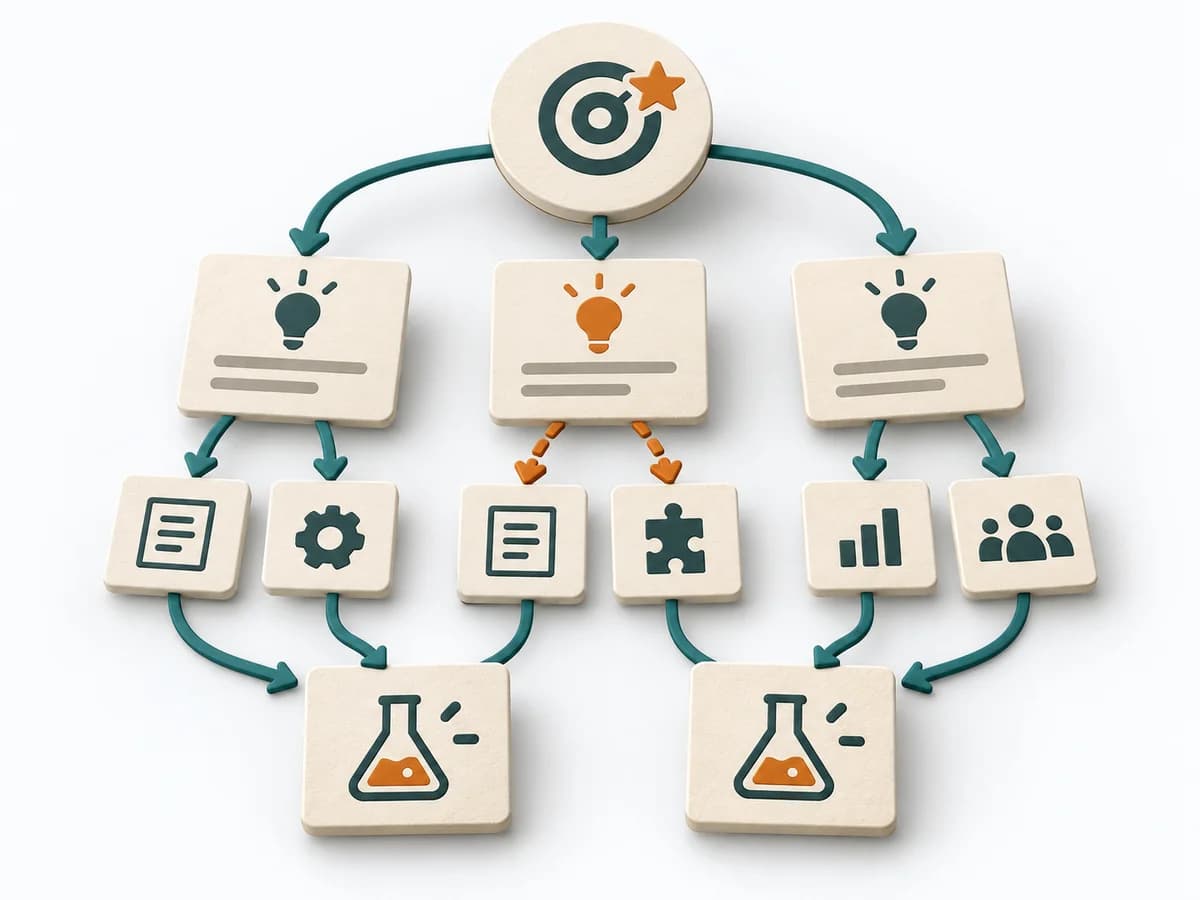 Product Discovery Opportunity Solution Tree |  Knowledge Modeling Event Modeling |  Product Strategy Counter Metrics |
|---|---|---|---|
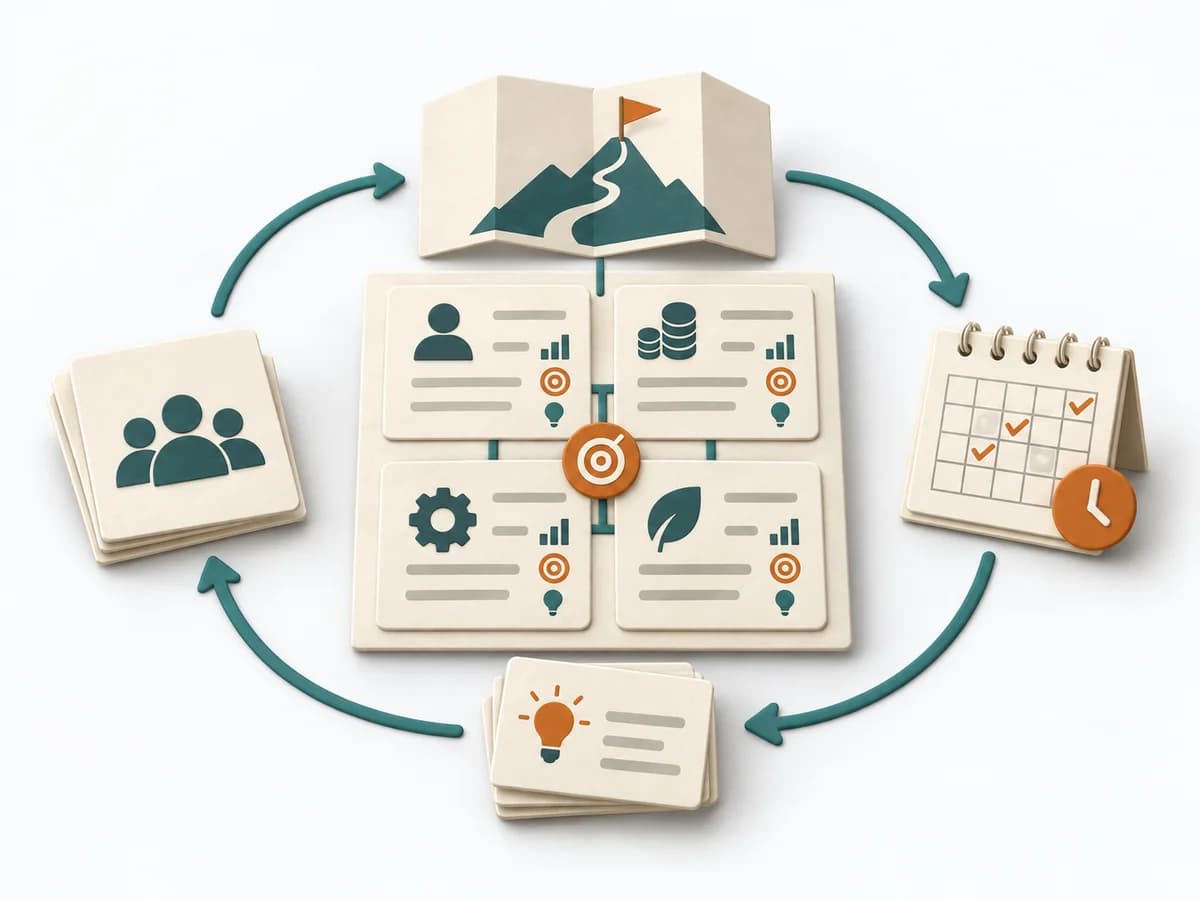
Purposedifferent | When discovery keeps swinging between goals, ideas, and learning loops, it creates clear steering logic. It connects the desired outcome, opportunities, and experiments into a legible structure. | Event Modeling connects business workflows with commands, events, and views into one coherent mental model. It helps design behavior, UI, and technical slices from the same underlying logic. | When a headline metric could mask side effects, it adds guardrail signals against unwanted outcomes. It connects customer value, product logic, and decision priorities. The result is captured as a counter-metric list and guardrail definitions. |
Complexitydifferent | Medium | Medium | Low |
Timedifferent | 1-2 h Setup, laufend | 2-6 h | 30-60 min |
Participantsdifferent | 2-6 | 2-8 | 2-6 |
Formatsame | Workshop + async | Workshop + async | Workshop + async |
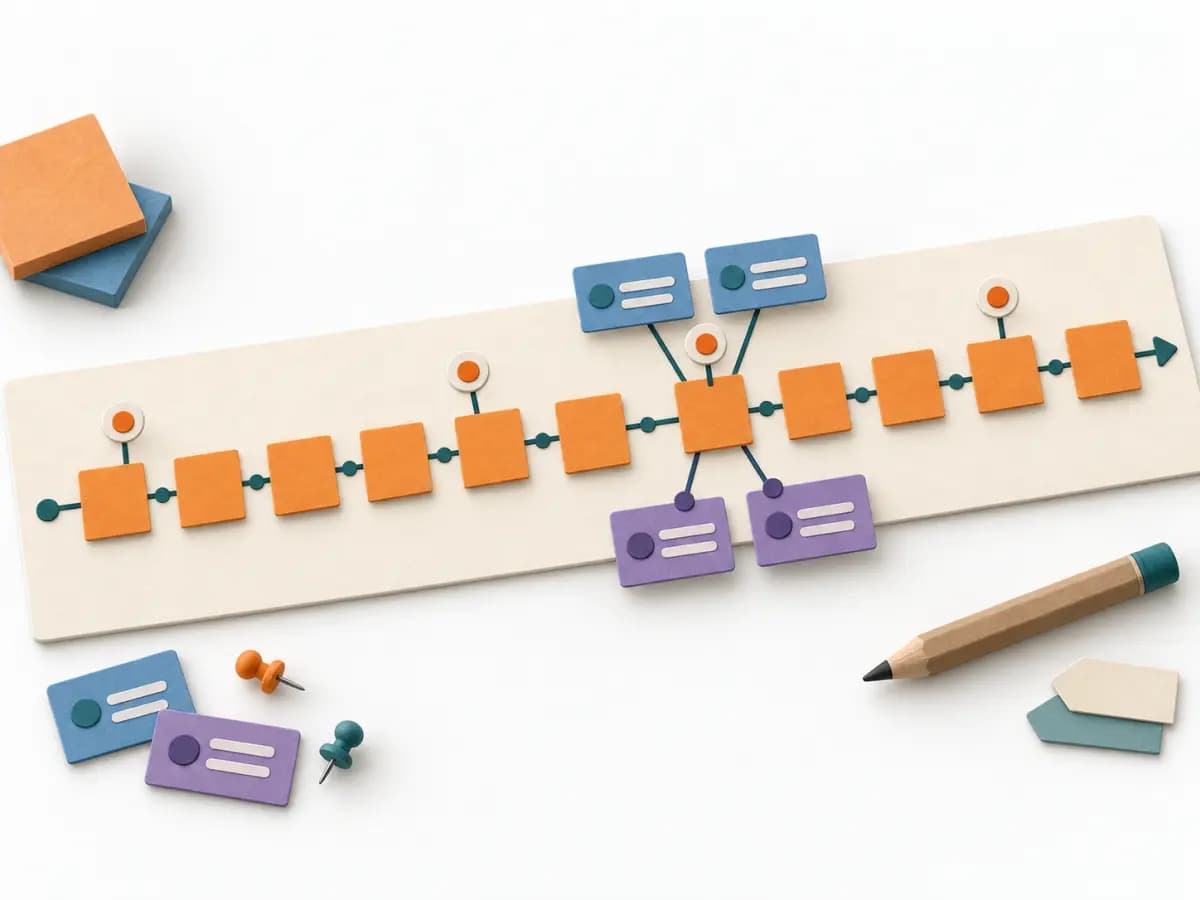
Outputdifferent | Opportunity Solution Tree, Experiment Backlog, Learning Log | Event Model, UI Flow, Commands, Read Models | Counter Metric List, Guardrail Definitions |
Tagsno overlap | DiscoveryOutcomesExperimentsOpportunity | EventsBlueprintDomain-Driven DesignBehavior | MetricsMeasurementStrategyExperiments |
Often compared together
Methods with strong topical overlap with the current selection, not yet in the comparison.