View methods side by side.
Choose up to four methods. Add them using the search and share the comparison by copying its link.
| Criterion | 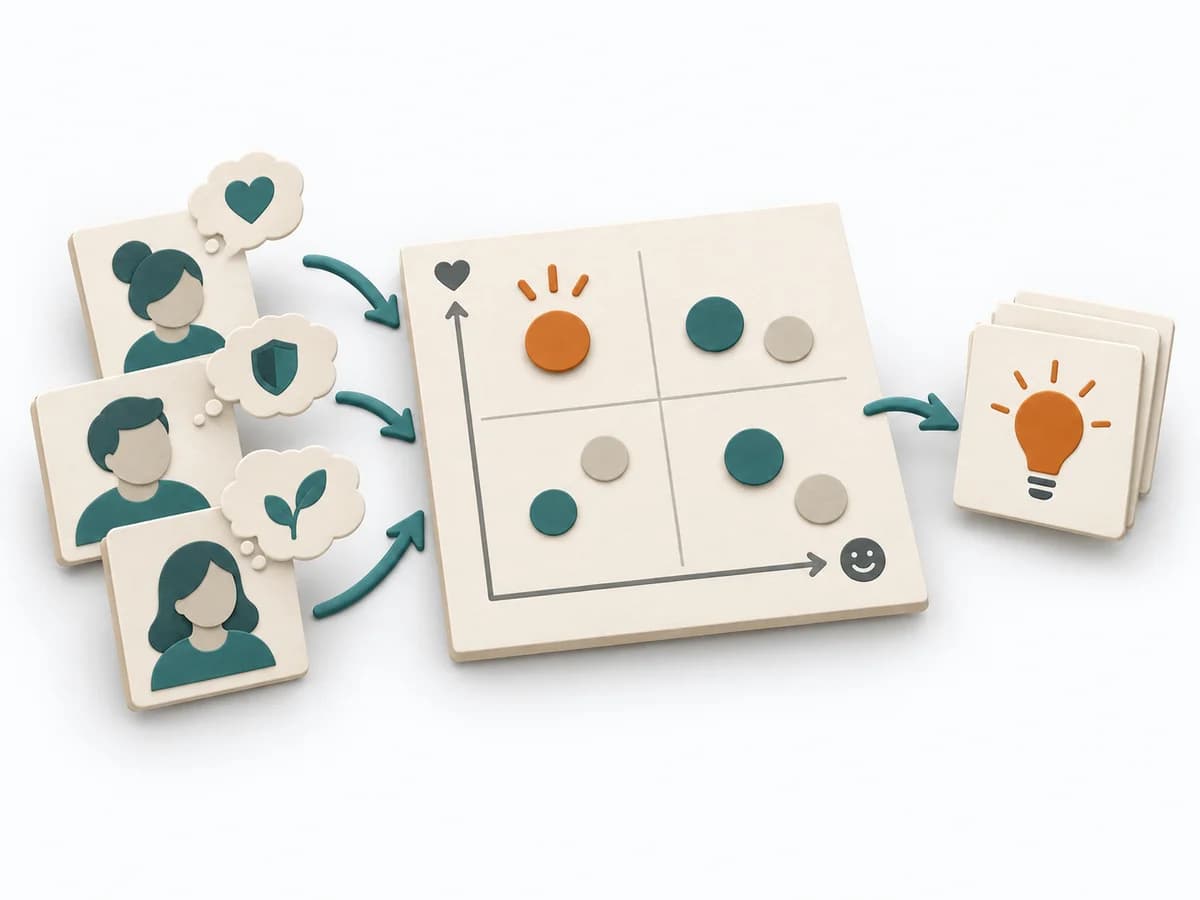 Product Discovery Outcome-Driven Innovation | 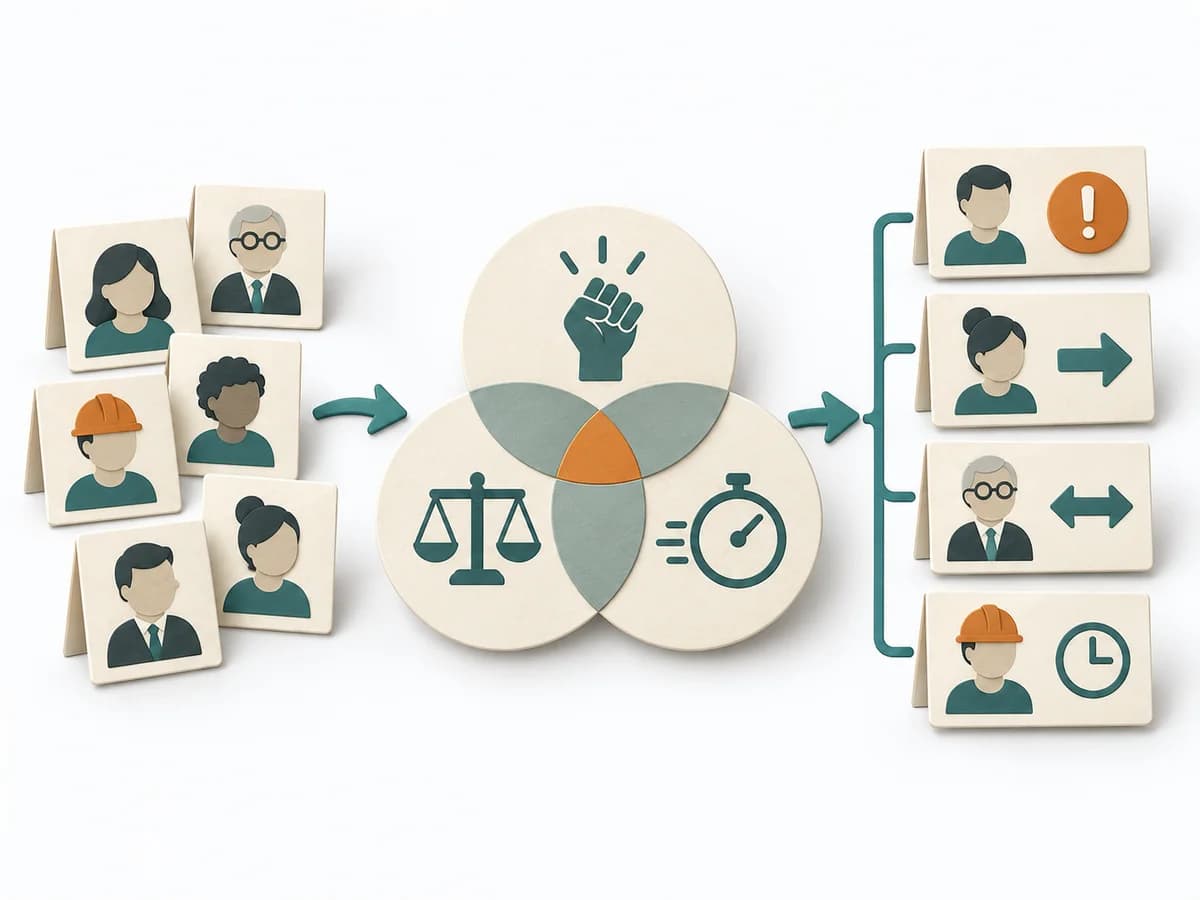 Facilitation Stakeholder Salience Model |  Facilitation Alignment Mapping |
|---|---|---|---|
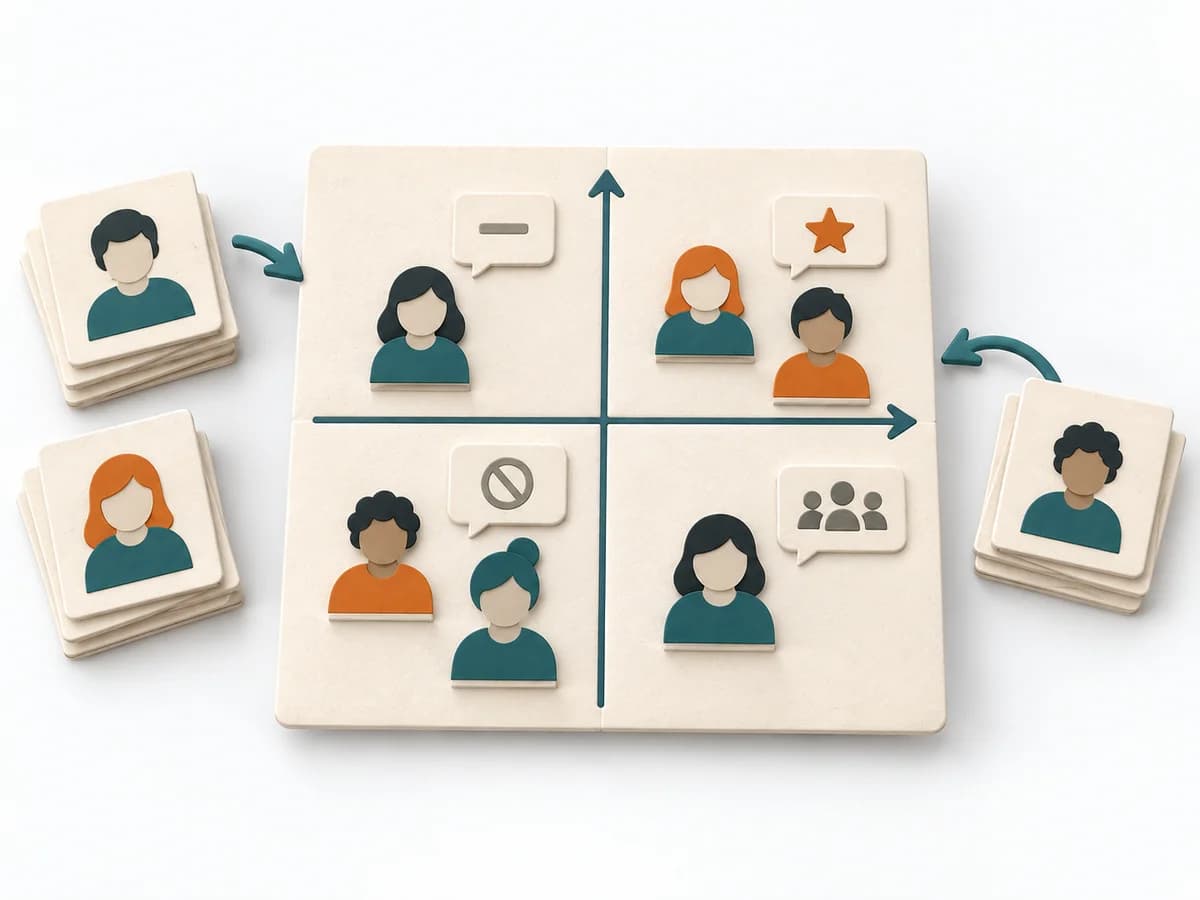
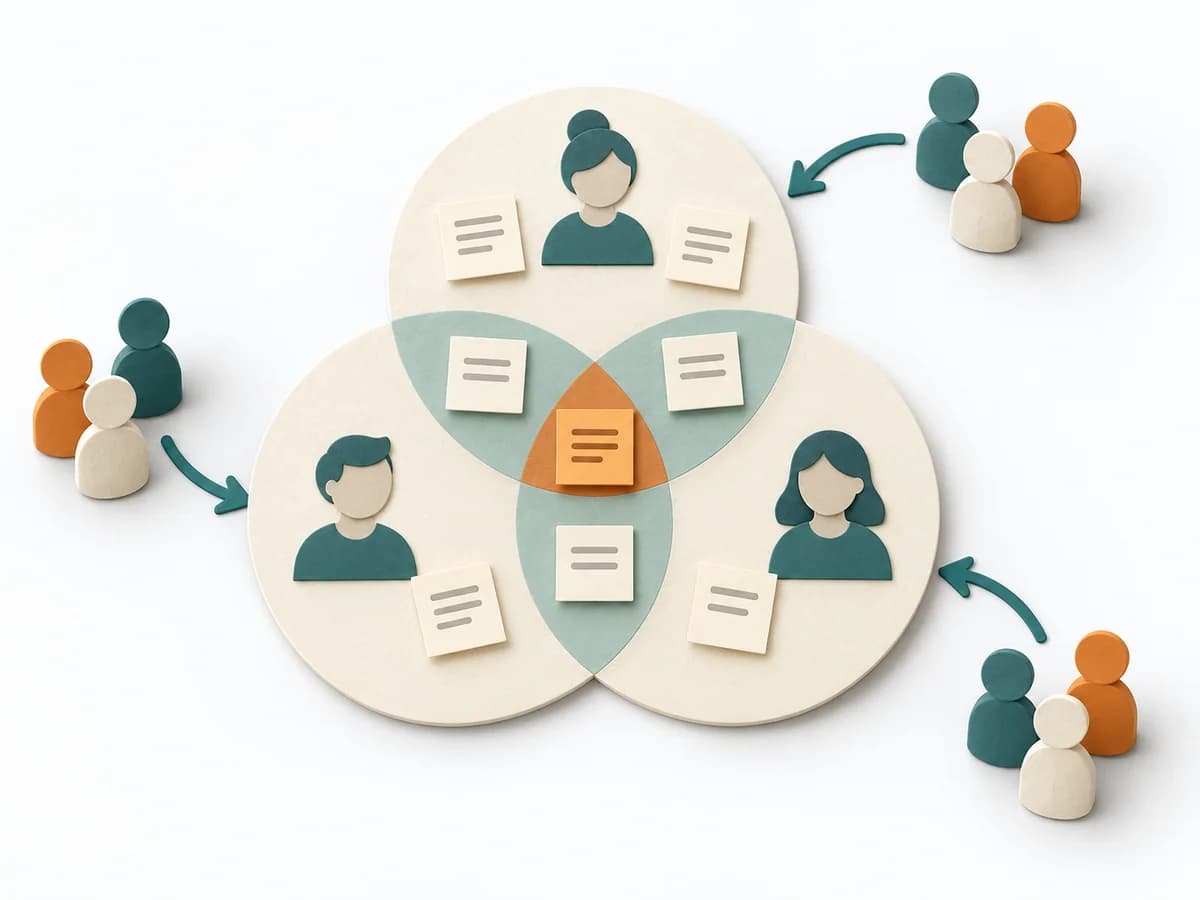
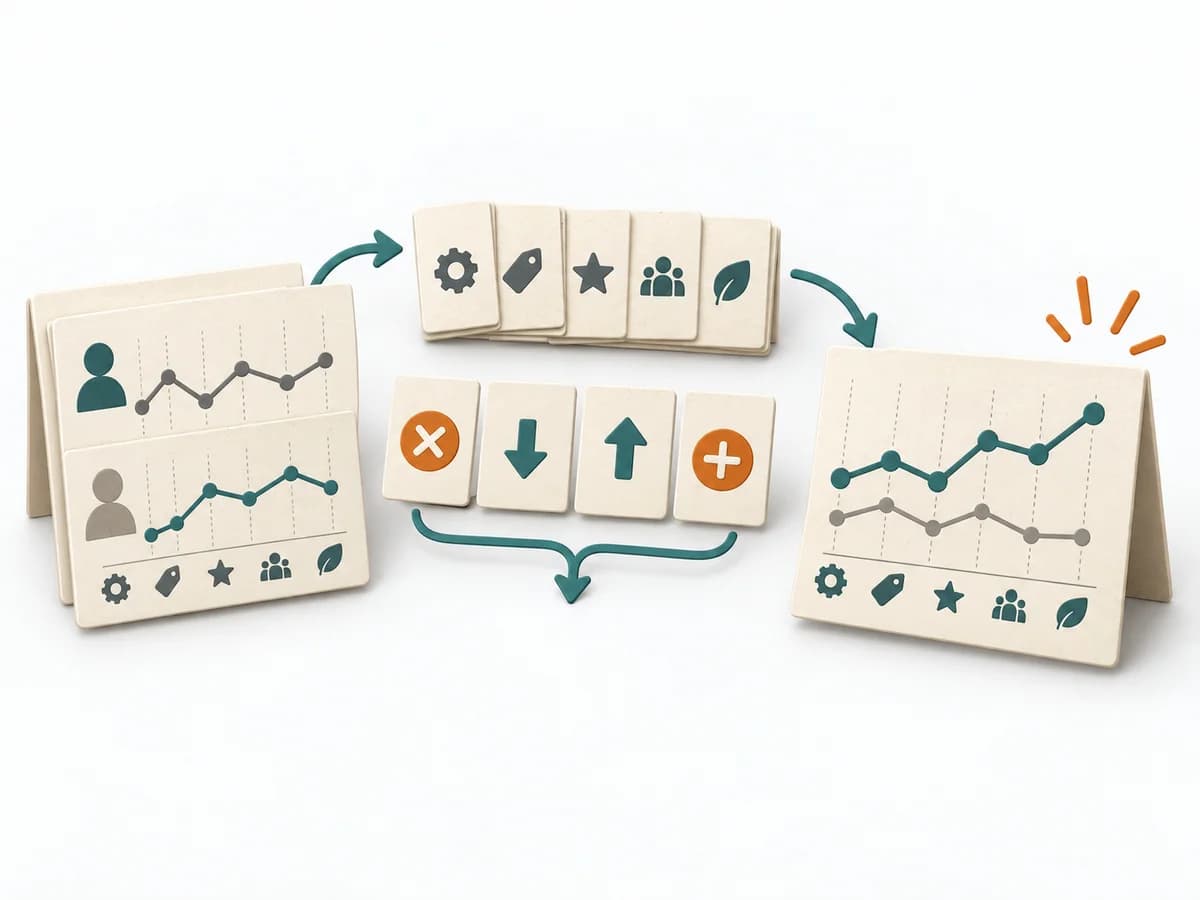
Purposedifferent | Outcome-Driven Innovation clarifies customer problems, solution opportunities, and evidence. It separates jobs, desired outcomes, importance, satisfaction, and opportunity, and captures results as desired outcome statements, an opportunity landscape, and segments by underserved needs. | When stakeholders appear to matter very differently, the Stakeholder Salience Model rates their actual priority through power, legitimacy, and urgency. It turns individual contributions into a visible selection. The result is captured as a Salience diagram and a class-based strategy. | When several people work toward one goal but hold different mental maps, Alignment Mapping makes the discrepancies visible. It arranges goals, assumptions, and priorities so shared direction becomes verifiable. |
Complexitydifferent | High | Medium | Medium |
Timedifferent | Mehrere Wochen | 60-90 min | 1-2 h |
Participantsdifferent | 2-6 researchers plus sample | 3-6 | 4-12 |
Formatdifferent | Workshop + async | Workshop | Workshop |
Outputdifferent | Desired outcome statements, Opportunity landscape, Segmentation by underserved needs, Innovation hypotheses | Salience Diagram, Strategy per Class | Alignment Map, Open Issues, Decision Questions |
Tagsno overlap | OutcomesInnovationResearchQuantitative | StakeholdersFacilitationAlignmentGovernance | AlignmentStakeholdersStrategyFacilitation |
Often compared together
Methods with strong topical overlap with the current selection, not yet in the comparison.