View methods side by side.
Choose up to four methods. Add them using the search and share the comparison by copying its link.
| Criterion |  Product Discovery Outcome-Driven Innovation | 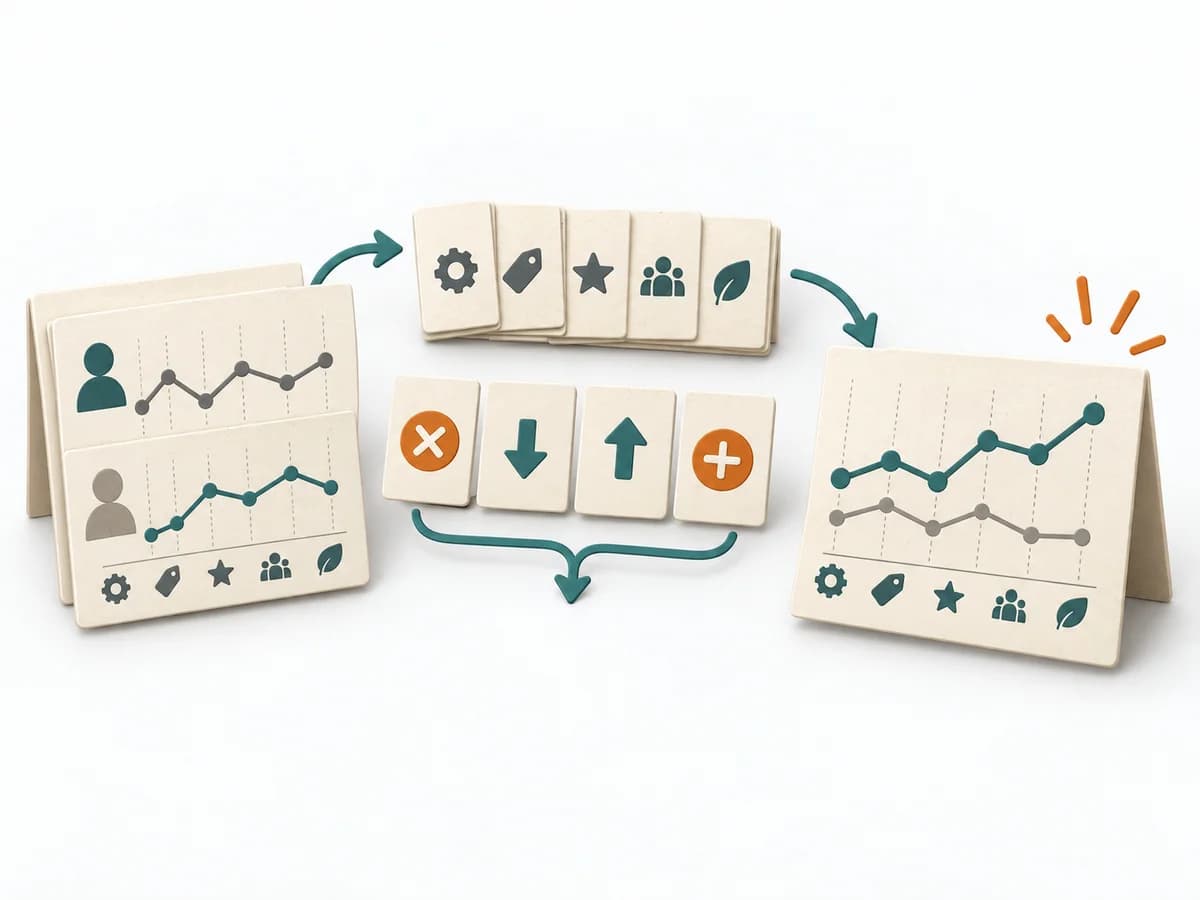 Business Strategy Blue Ocean Strategy Canvas | 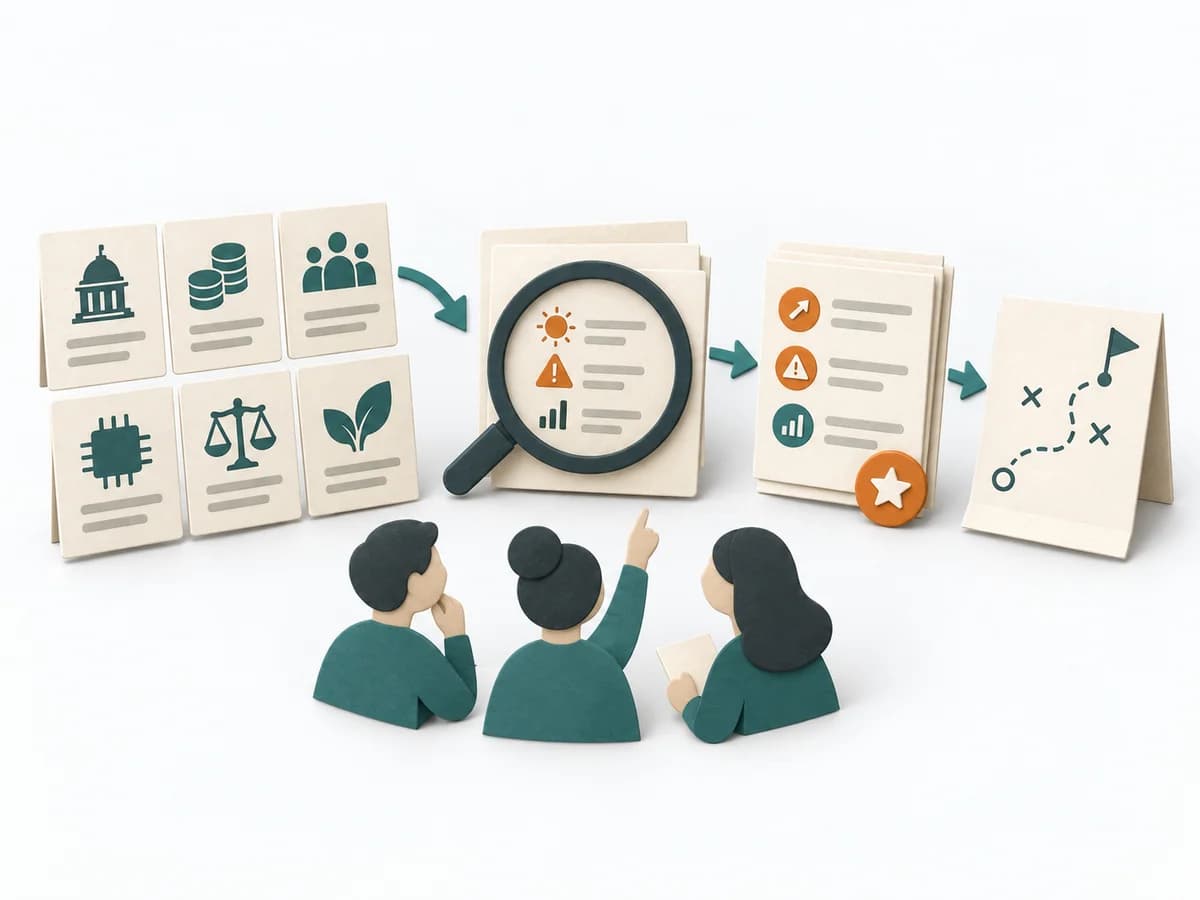 Business Strategy PESTLE Analysis |
|---|---|---|---|
Purposedifferent | Outcome-Driven Innovation clarifies customer problems, solution opportunities, and evidence. It separates jobs, desired outcomes, importance, satisfaction, and opportunity, and captures results as desired outcome statements, an opportunity landscape, and segments by underserved needs. | The Blue Ocean Strategy Canvas shows how an offering is positioned relative to the market. Differentiation thereby becomes tangible in value factors instead of merely being claimed. | PESTLE Analysis makes political, economic, social, technological, legal, and environmental influences visible. The environment of an initiative is thereby read systematically instead of through isolated trends. |
Complexitydifferent | High | Medium | Medium |
Timedifferent | Mehrere Wochen | 2-4 h | 1-3 h |
Participantsdifferent | 2-6 researchers plus sample | 3-10 | 2-10 |
Formatdifferent | Workshop + async | Workshop | Workshop + async |
Outputdifferent | Desired outcome statements, Opportunity landscape, Segmentation by underserved needs, Innovation hypotheses | Strategy Canvas, Value Curve, ERRC Actions | PESTLE Map, External Risks, Strategic Questions |
Tagsno overlap | OutcomesInnovationResearchQuantitative | StrategyPositioningInnovationValue | StrategyMarketAnalysis |
Often compared together
Methods with strong topical overlap with the current selection, not yet in the comparison.