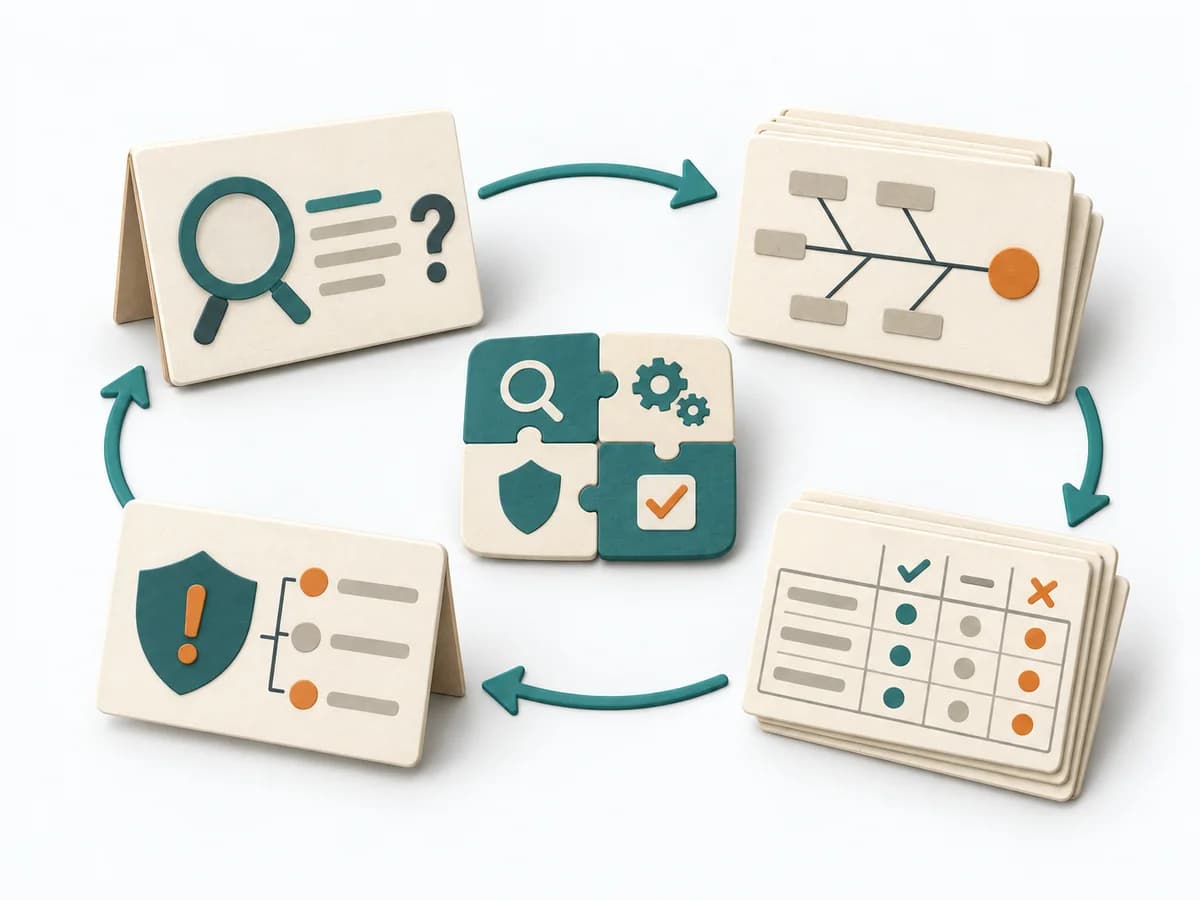
View methods side by side.
Choose up to four methods. Add them using the search and share the comparison by copying its link.
| Criterion | 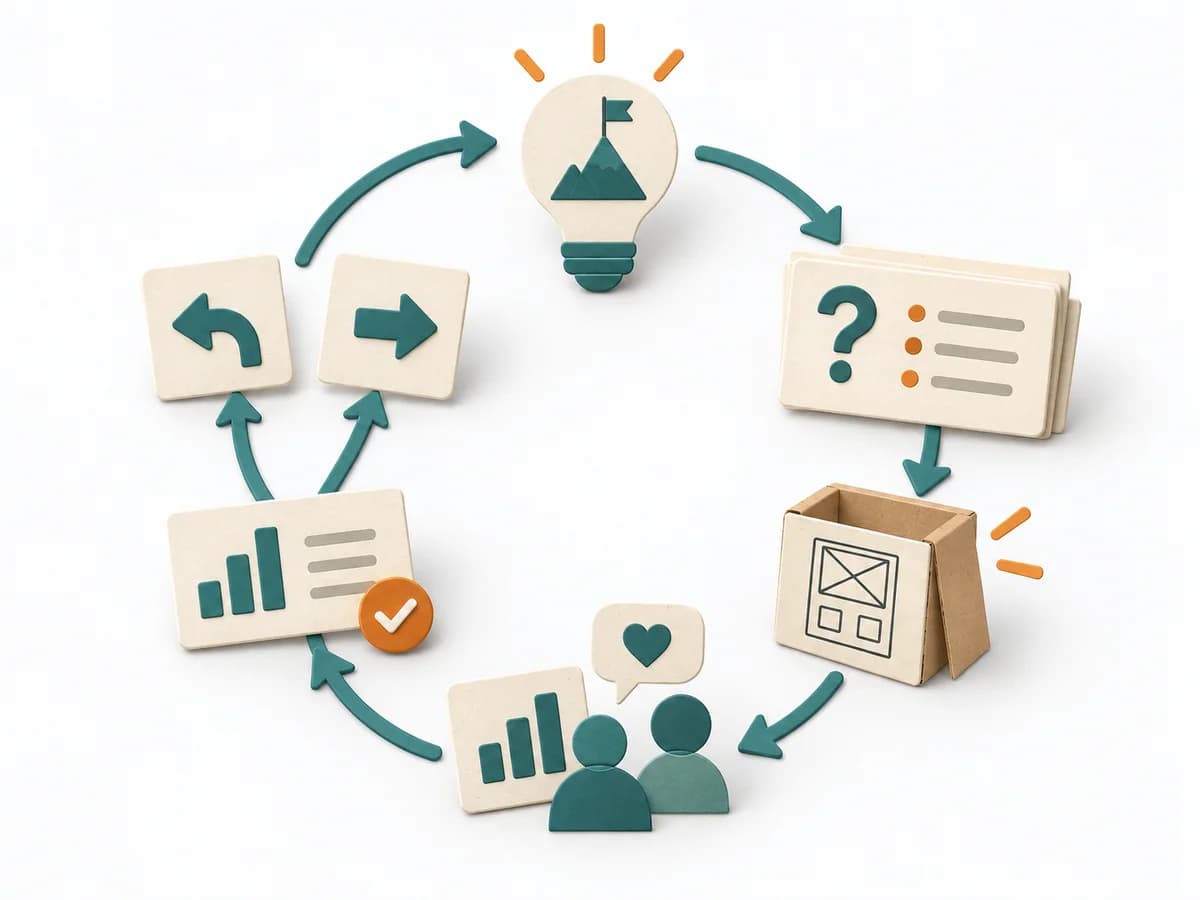 Innovation Lean Startup | 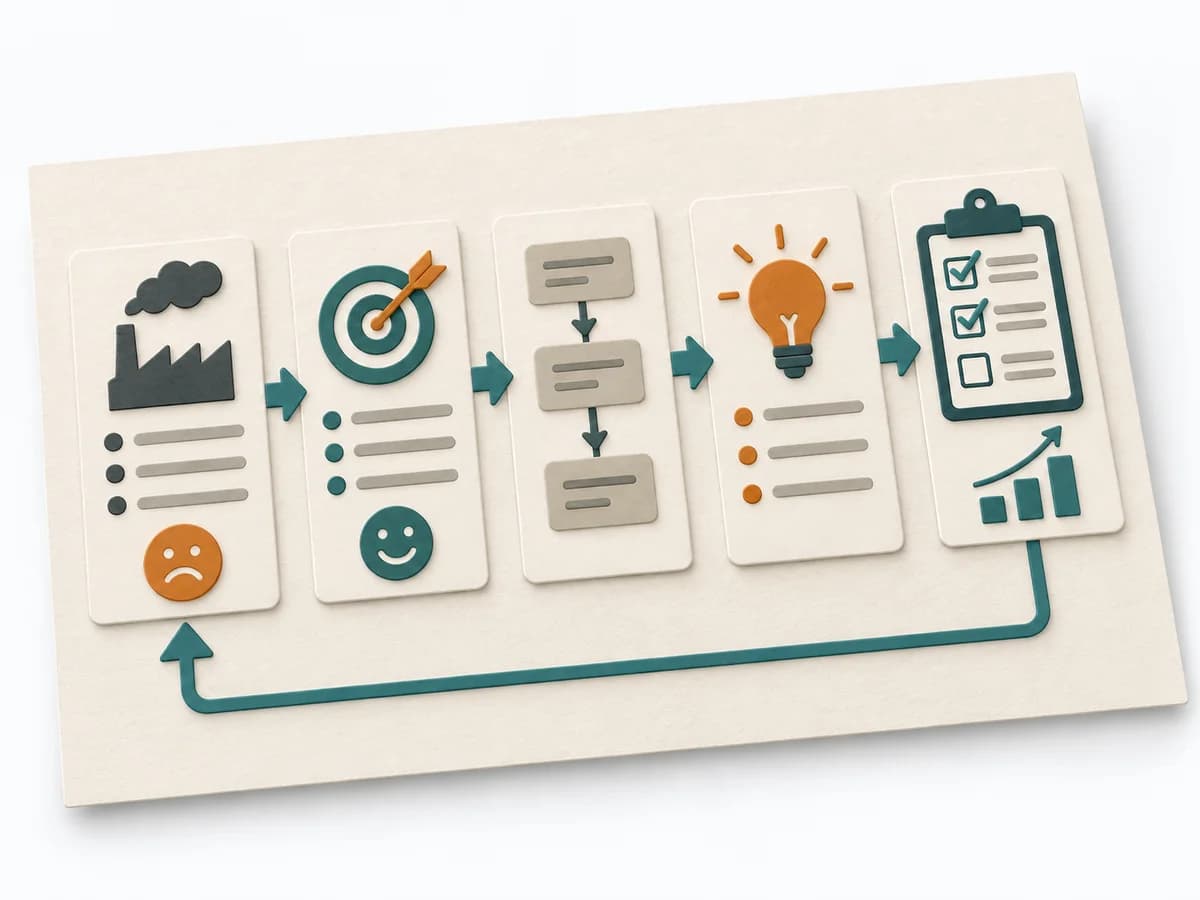 Operations A3 Problem Solving |  Operations Fishbone Diagram |
|---|---|---|---|
Purposedifferent | For uncertain business assumptions, the method forces the idea into contact with real market reactions early. It separates wishful picture, assumption, and observable behavior, so that learning becomes faster than planning. This translates uncertainty into measurable insight. | For a complex deviation with several people involved, the method bundles problem, analysis, and decision onto one page. It creates a shared working space where causes, countermeasures, and follow-up fit together. | When a problem has several possible contributing factors, the method sorts causes by cause areas. It prevents an initial hunch from blocking the view of other plausible drivers. |
Complexitydifferent | Medium | Medium | Low |
Timedifferent | Wochen bis Monate je Lernzyklus | 45-90 min | 30-60 min |
Participantsdifferent | 2-8 | 2-5 | 2-8 |
Formatdifferent | Workshop + async | Workshop + async | Workshop |
Outputdifferent | Hypothesis list, MVPs, Learning reports, Pivot or persevere decision | A3 Report, Action Plan, Root Cause Analysis | Fishbone Diagram, Cause Categories, Investigation Backlog |
Tagsno overlap | LeanStartupValidationMVP | LeanProblem solvingCoachingOperations | Root causeQualityOperations |
Often compared together
Methods with strong topical overlap with the current selection, not yet in the comparison.