View methods side by side.
Choose up to four methods. Add them using the search and share the comparison by copying its link.
| Criterion | 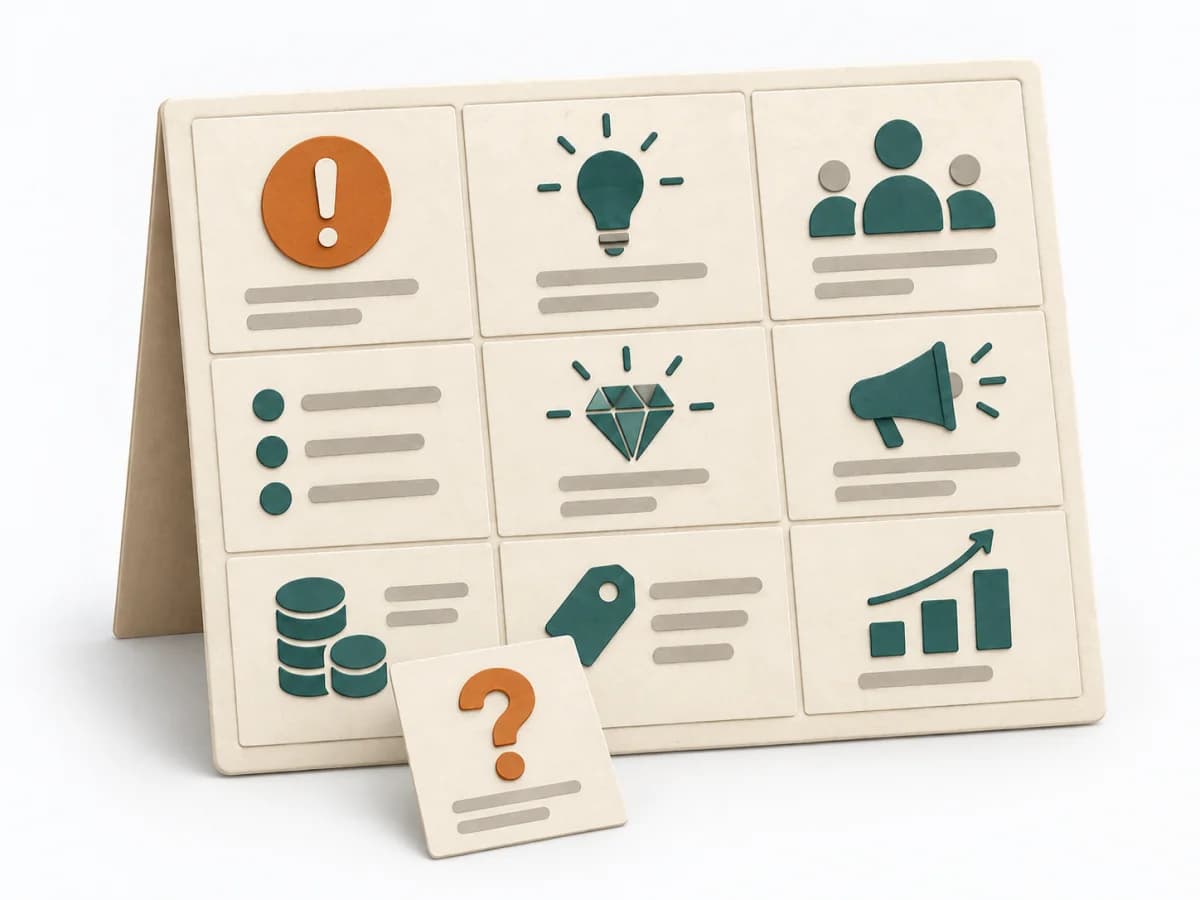 Product Strategy Lean Canvas | 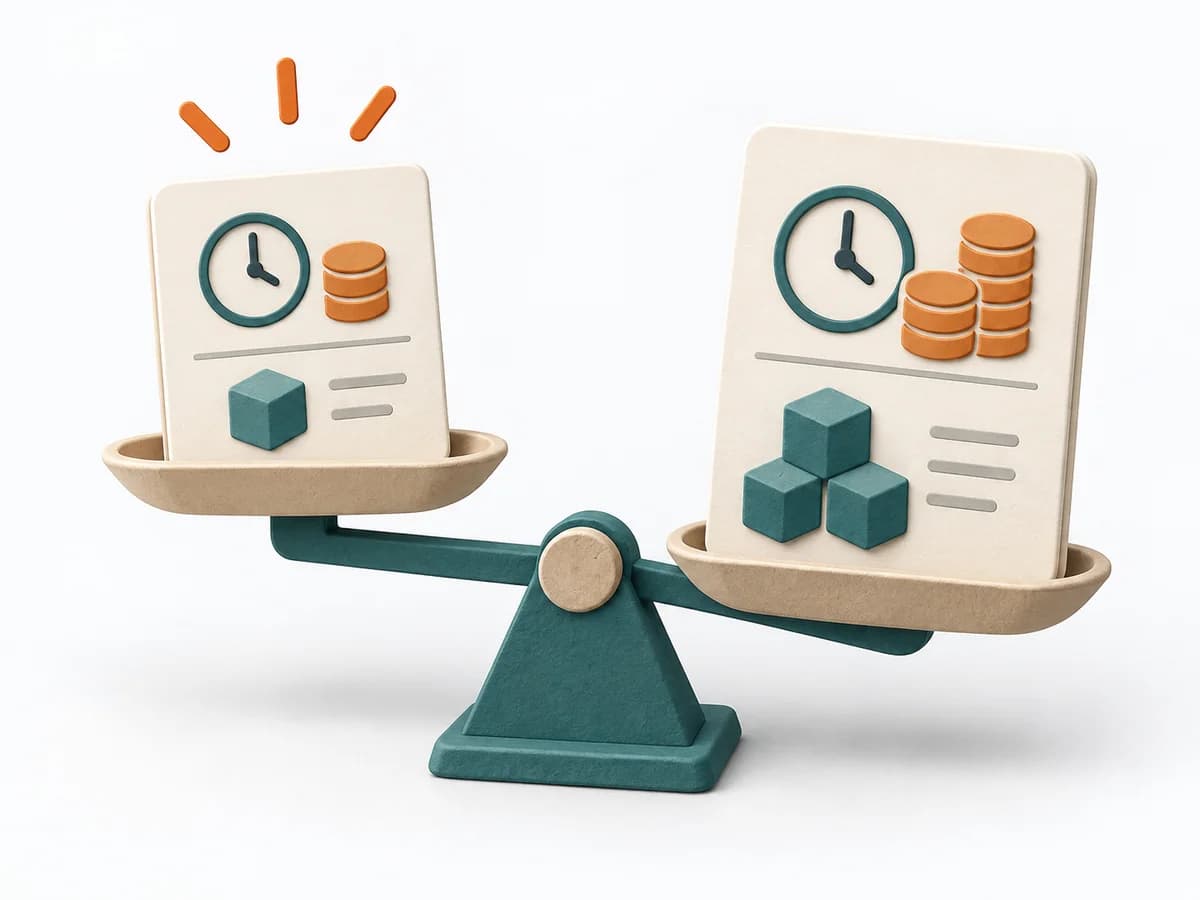 Agile WSJF | 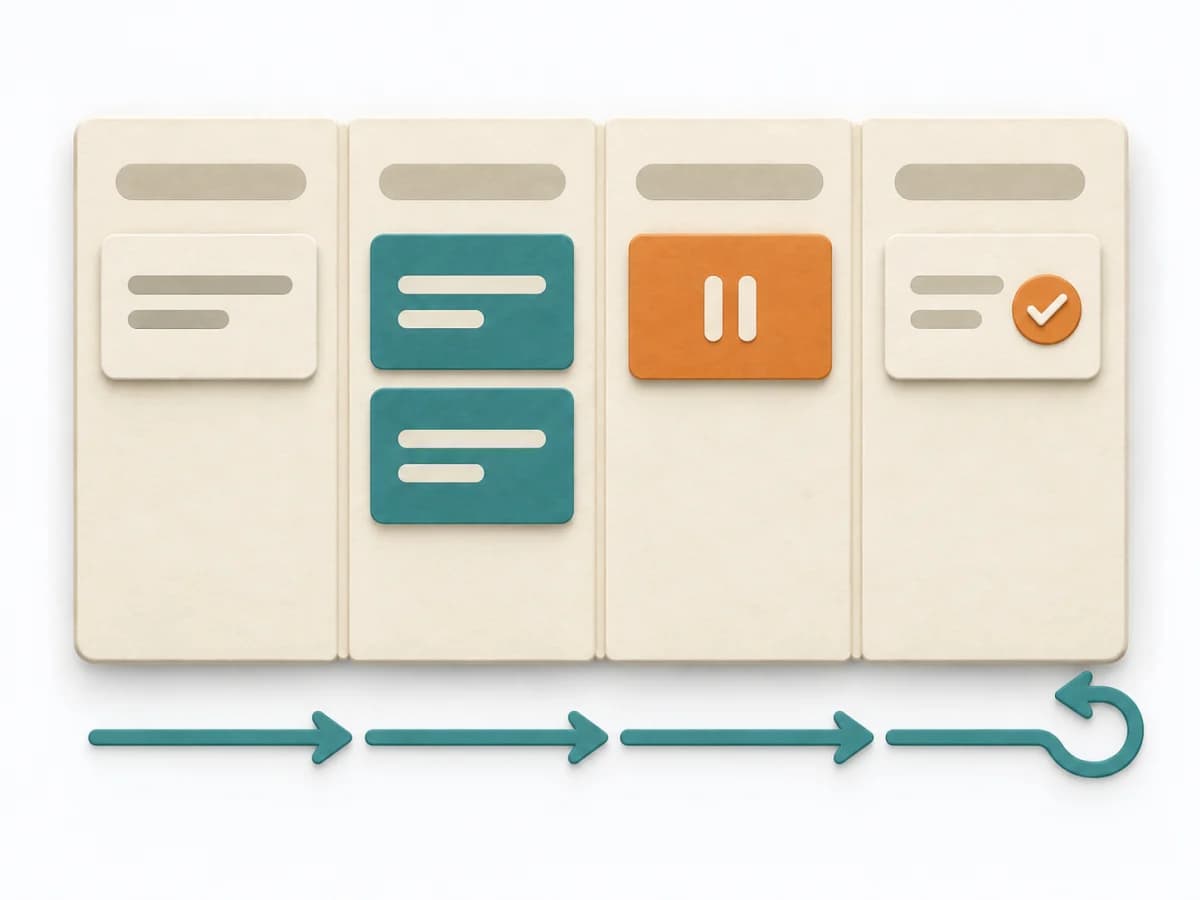 Engineering Kanban |
|---|---|---|---|
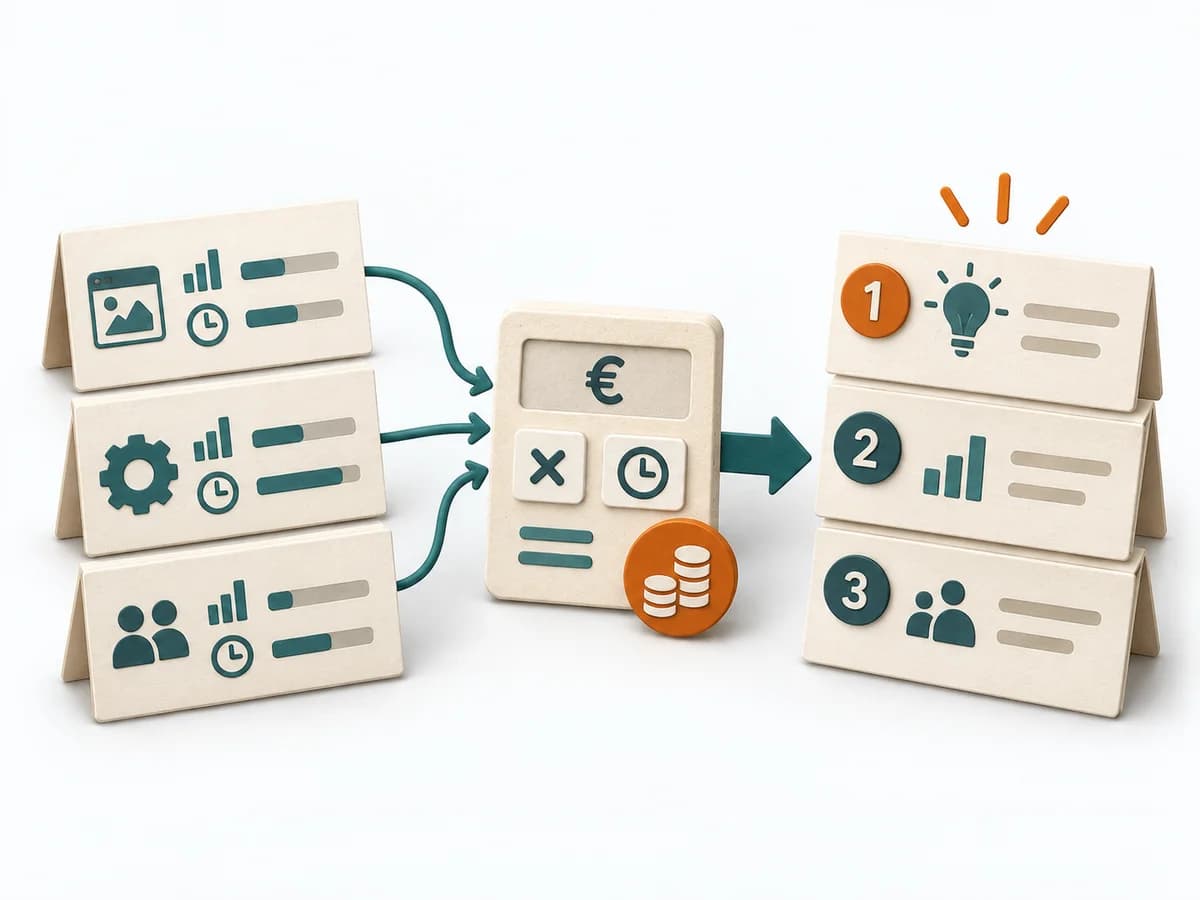
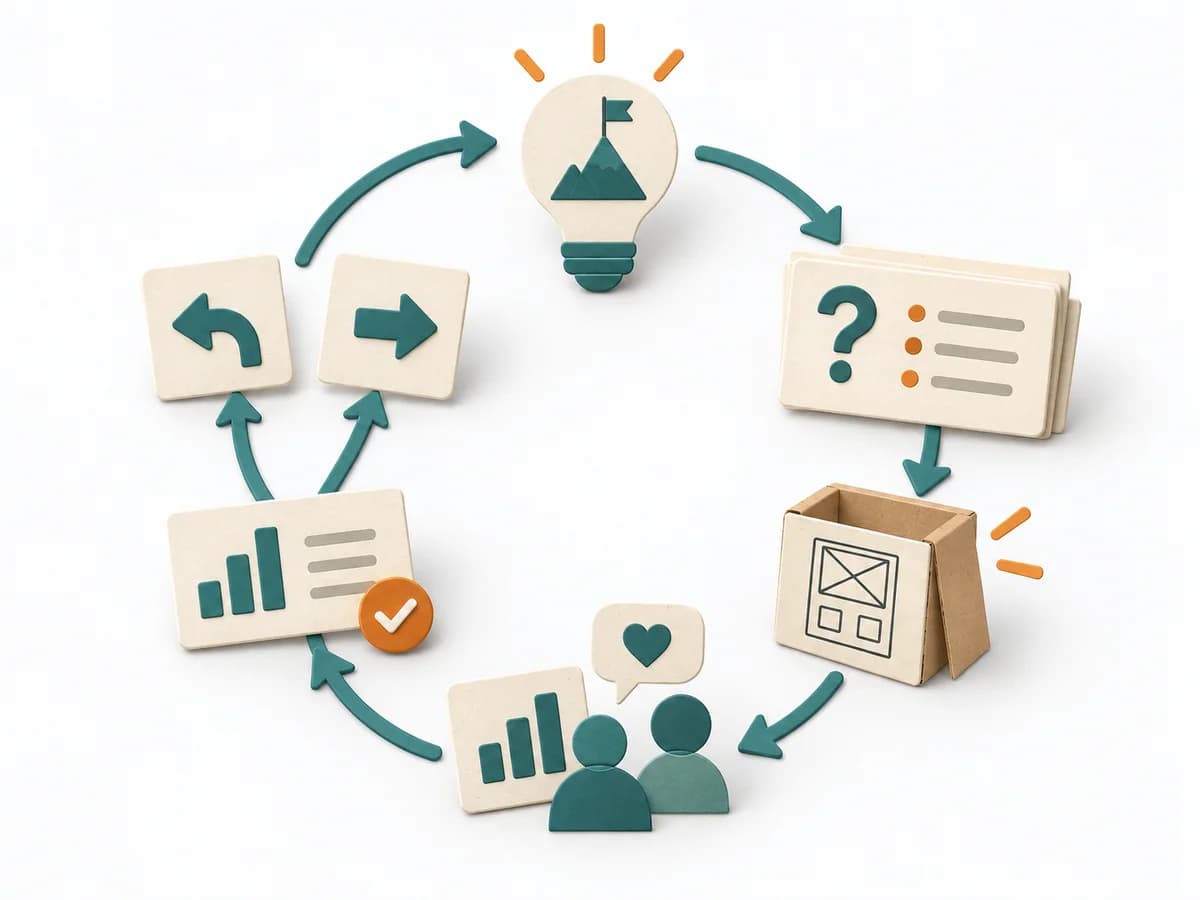
Purposedifferent | When an early product bet still has too many open points, it brings target group, problem, and assumptions into a single view. It condenses the idea so core risks become nameable. | When many tasks compete for the same capacity, it orders work by economic impact. It makes time lost, benefit, and effort comparable together. | When work sits in too many parallel streams, throughput suffers and no one sees the bottlenecks. Kanban makes the flow of work visible and limits overload so a system becomes calmer and more predictable. |
Complexitydifferent | Medium | High | Medium |
Timedifferent | 45-90 min | 45-90 min | Ongoing |
Participantsdifferent | 1-6 | 3-10 | 2-12 |
Formatdifferent | Workshop + async | Workshop | Workshop + async |
Outputdifferent | Lean Canvas, Core Assumptions, Experiment Backlog | Ranked Backlog, Cost-of-Delay Assumptions | Kanban board, WIP policies, Flow metrics |
Tagsno overlap | StartupLeanAssumptionsBusiness model | LeanEconomicsSequencePrioritization | FlowVisual managementDelivery |
Often compared together
Methods with strong topical overlap with the current selection, not yet in the comparison.