View methods side by side.
Choose up to four methods. Add them using the search and share the comparison by copying its link.
| Criterion | 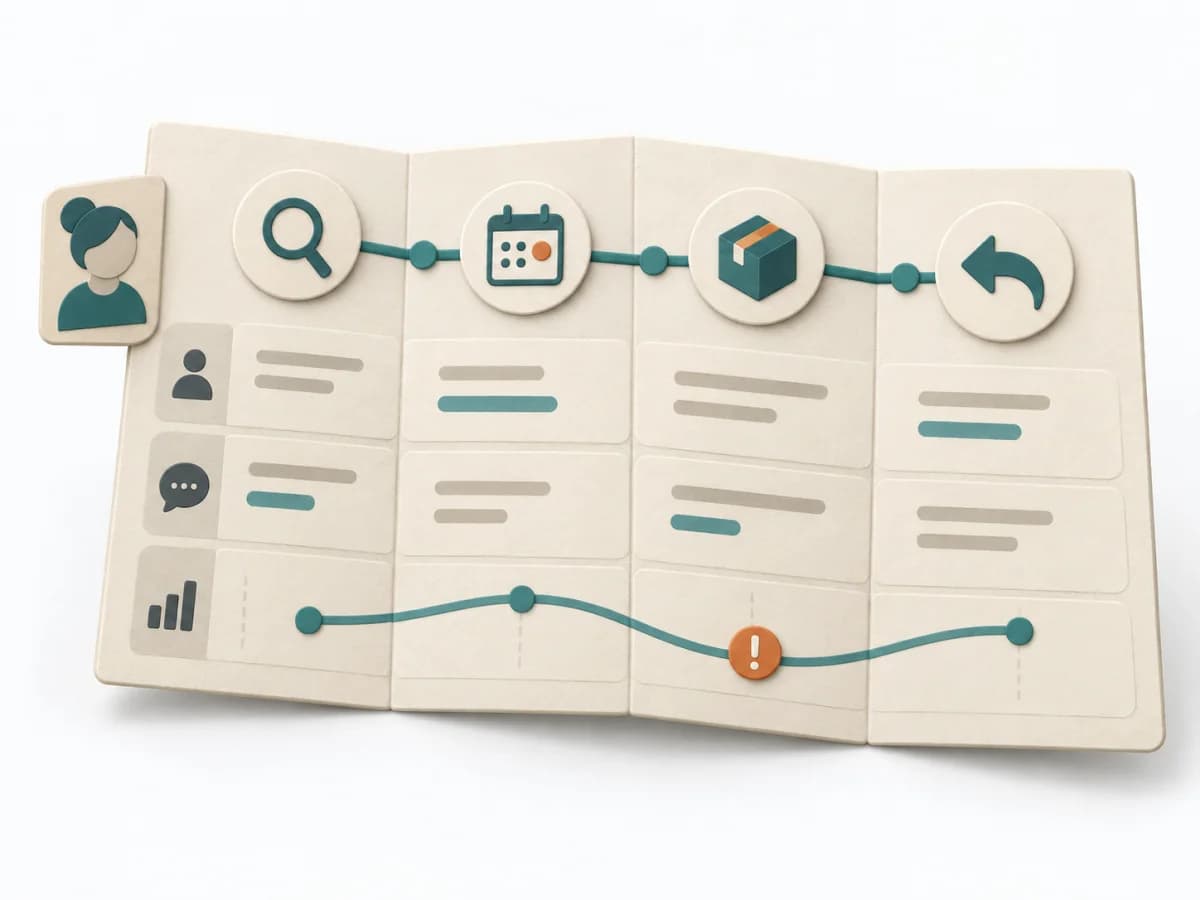 UX Research Customer Journey Mapping |  Operations Fishbone Diagram | 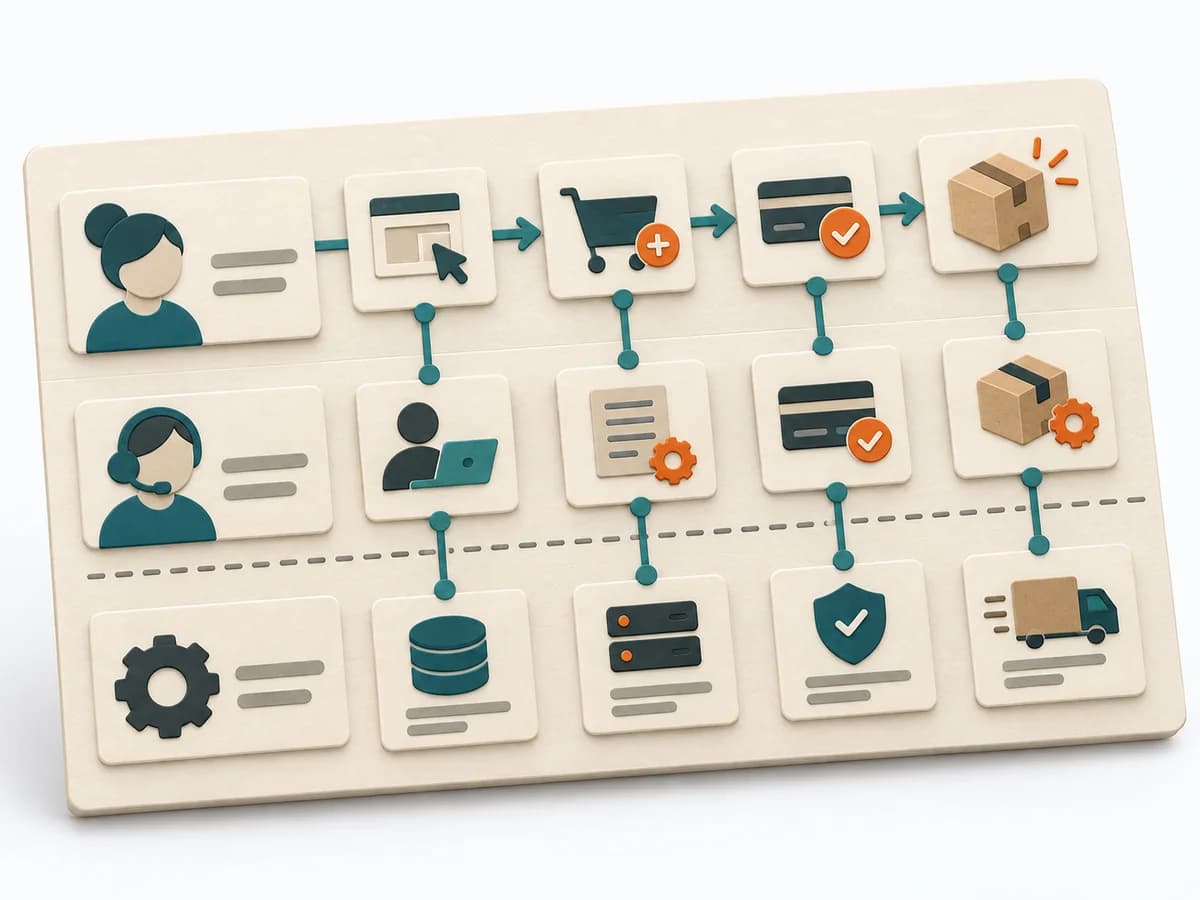 UX Design Service Blueprinting |
|---|---|---|---|
Purposedifferent | When a user journey falls apart across many touchpoints, customer journey mapping makes the experience visible as a coherent arc. Phases, emotions, and breaks become legible enough to prioritize critical moments deliberately. | When a problem has several possible contributing factors, the method sorts causes by cause areas. It prevents an initial hunch from blocking the view of other plausible drivers. | When a service experience is spread across several touchpoints, it brings frontstage and backstage together. It shows where user contact and internal responsibility must fit. |
Complexitydifferent | Medium | Low | High |
Timedifferent | 2-4 h | 30-60 min | 0.5-2 Tage |
Participantsdifferent | 4-10 | 2-8 | 6-12 |
Formatsame | Workshop | Workshop | Workshop |
Outputdifferent | Journey Map, Pain-point List, Opportunity Backlog | Fishbone Diagram, Cause Categories, Investigation Backlog | Service Blueprint, Fail Points, Ownership Map |
Tagsno overlap | JourneyServiceService design | Root causeQualityOperations | Service designOperationsJourneyBlueprint |
Often compared together
Methods with strong topical overlap with the current selection, not yet in the comparison.