View methods side by side.
Choose up to four methods. Add them using the search and share the comparison by copying its link.
| Criterion |  Growth Hooked Model |  Systems Thinking Causal Loop Diagram |  Operations 5 Whys |
|---|---|---|---|
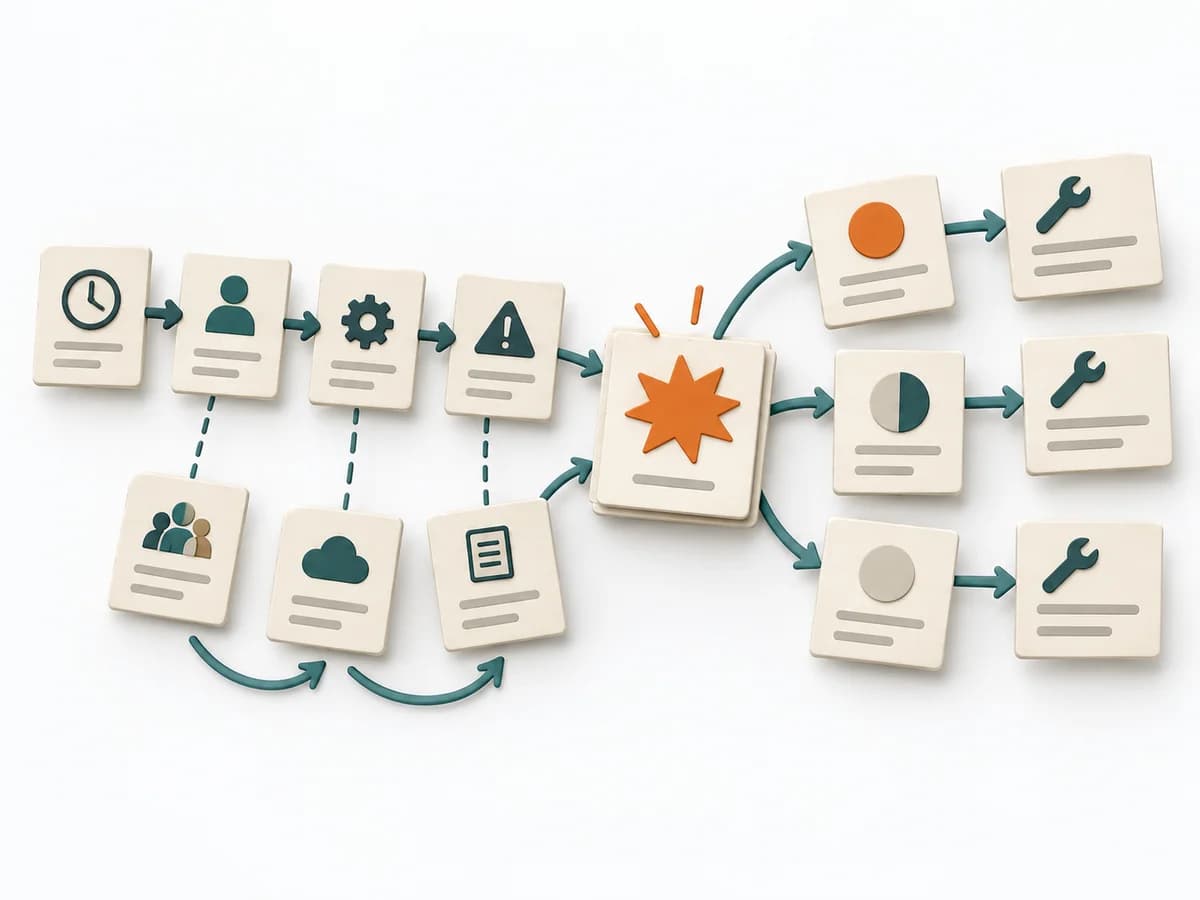
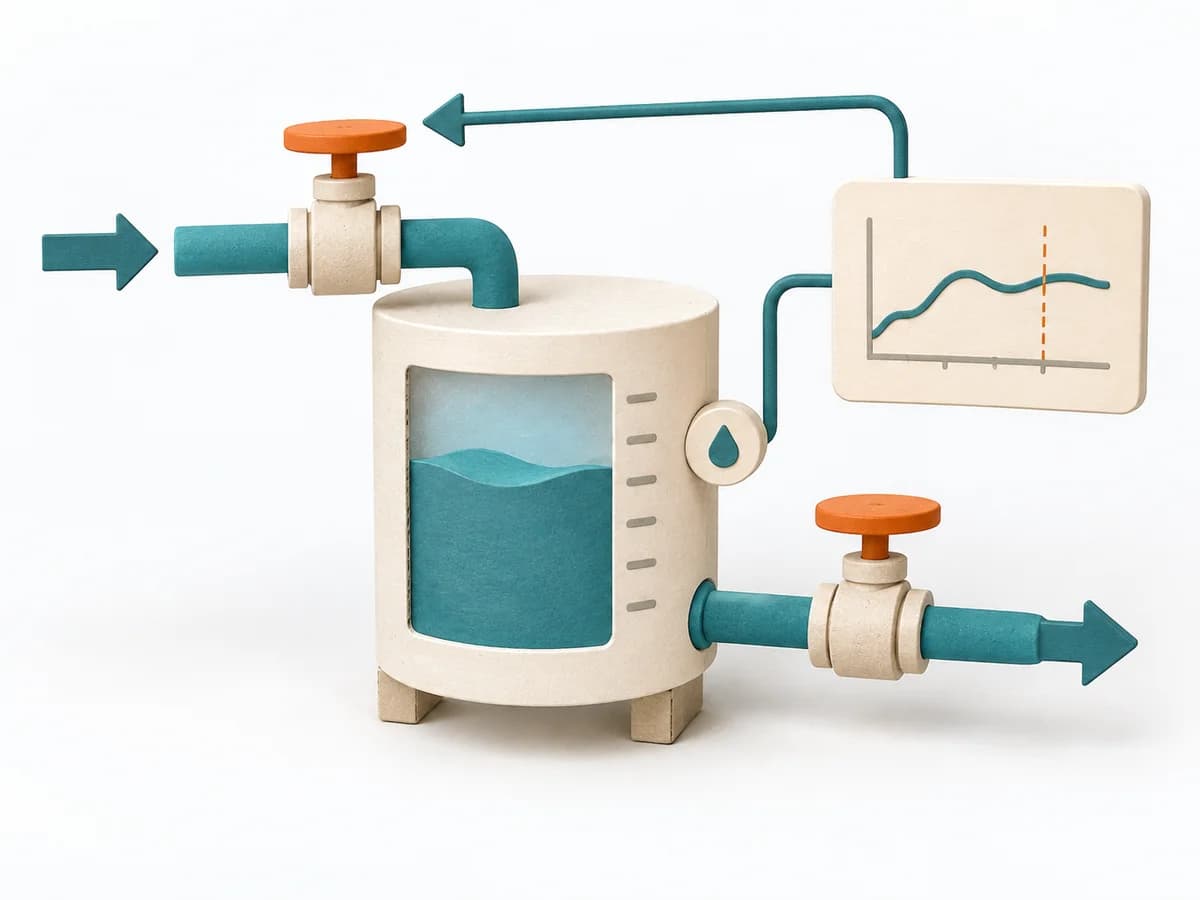
Purposedifferent | The Hooked Model helps clarify engagement loops, user behavior, and experiments. It makes repeat behavior measurable and captures the result as a hooked loop, trigger map, and reward design. | A Causal Loop Diagram makes feedback, reinforcement, and balance in a system legible. It uncovers side effects and self-reinforcement that stay hidden in linear explanations. | For a single, hard-to-explain deviation, the method exposes the causal chain behind the visible symptom. It keeps the cause open until a controllable condition emerges instead of a mere description. |
Complexitydifferent | Medium | Medium | Low |
Timedifferent | Multiple workshops over several weeks | 1-3 h | 15-30 min |
Participantsdifferent | 2-8 | 2-8 | 2-6 |
Formatdifferent | Workshop + async | Workshop | Workshop |
Outputdifferent | Hooked loop, Trigger map, Reward design, Ethics check | Causal Loop Diagram, Feedback Notes, Leverage Points | Root cause notes, Countermeasures |
Tagsno overlap | GrowthBehaviorRetention | FeedbackSystems thinkingCausalityDynamics | Root causeIncidentLeanProblem solving |
Often compared together
Methods with strong topical overlap with the current selection, not yet in the comparison.