View methods side by side.
Choose up to four methods. Add them using the search and share the comparison by copying its link.
| Criterion | 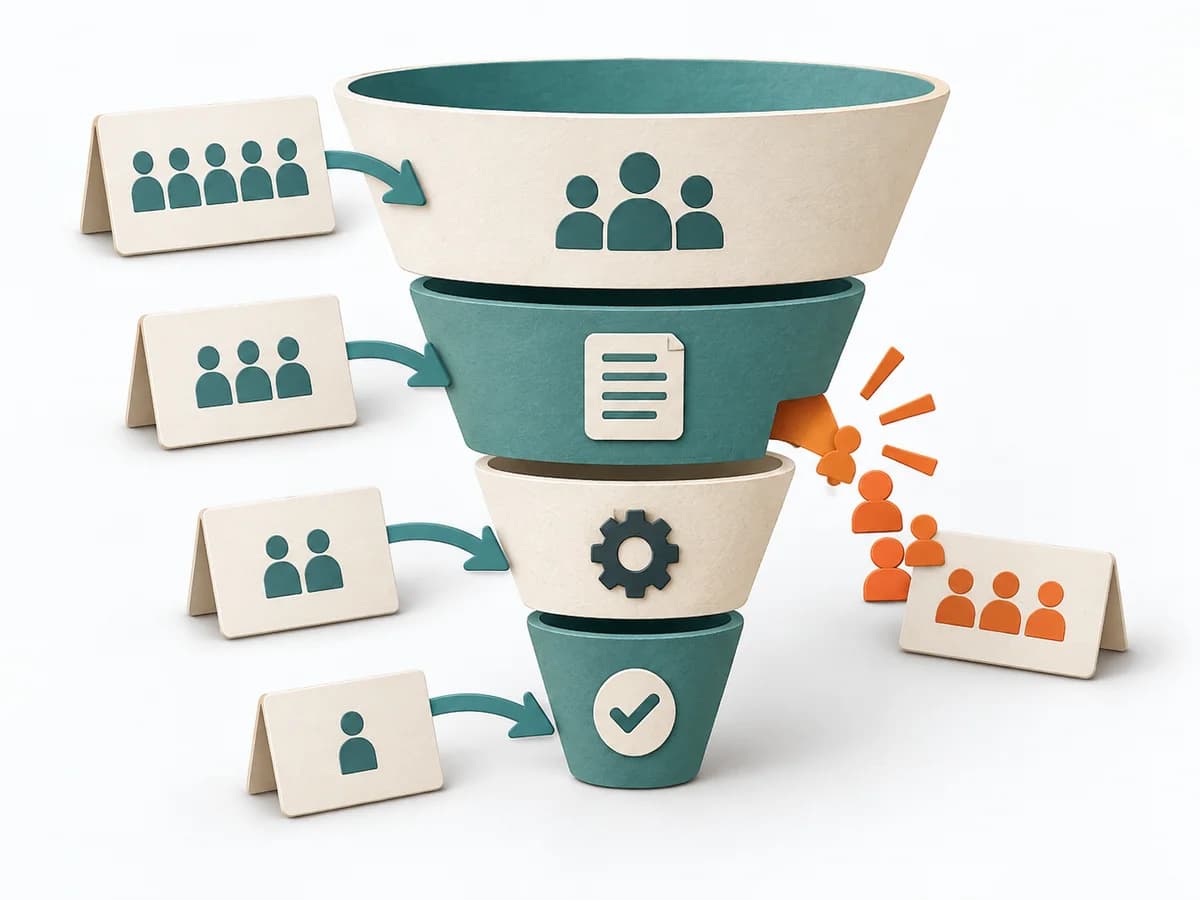 Growth Funnel Analysis |  Product Strategy KPI Tree | 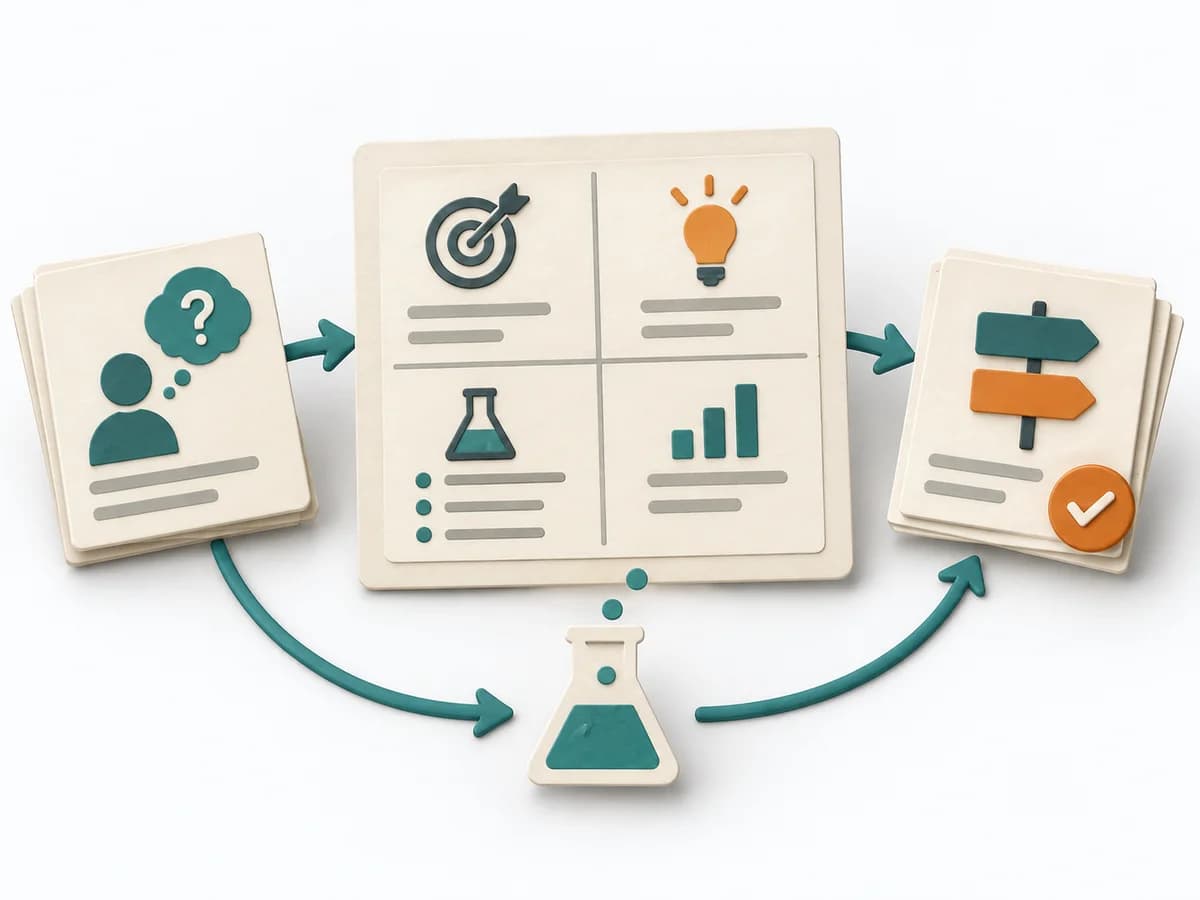 Product Discovery Experiment Canvas |
|---|---|---|---|
Purposedifferent | When many visitors or users drop off along the way, the reason behind the number often stays hidden. Funnel Analysis exposes these transitions and makes visible exactly where the path collapses. | When metrics across the organization drift apart, it arranges drivers and effects under one shared logic. It connects customer value, product logic, and decision priorities. The result is captured as a KPI tree and owner list. | When experiments become unreadable after the fact, it arranges hypothesis, signal, and learning goal on a single canvas. It separates problem, assumption, solution, and evidence. The result is captured as a Completed Experiment Canvas and a Success Metric. |
Complexitydifferent | Medium | Medium | Low |
Timedifferent | 1-3 h | 90-180 min initial, dann laufend | 30-60 min |
Participantsdifferent | 1-5 | 3-8 | 1-5 |
Formatdifferent | Async | Workshop + async | Workshop + async |
Outputdifferent | Funnel report, Drop-off analysis, Optimization hypotheses | KPI Tree, Owner List | Completed Experiment Canvas, Success Metric |
Tagsno overlap | AnalyticsConversionGrowth | MetricsStrategyAlignmentMeasurement | ExperimentsValidationDiscoveryHypothesis |
Often compared together
Methods with strong topical overlap with the current selection, not yet in the comparison.