View methods side by side.
Choose up to four methods. Add them using the search and share the comparison by copying its link.
| Criterion | 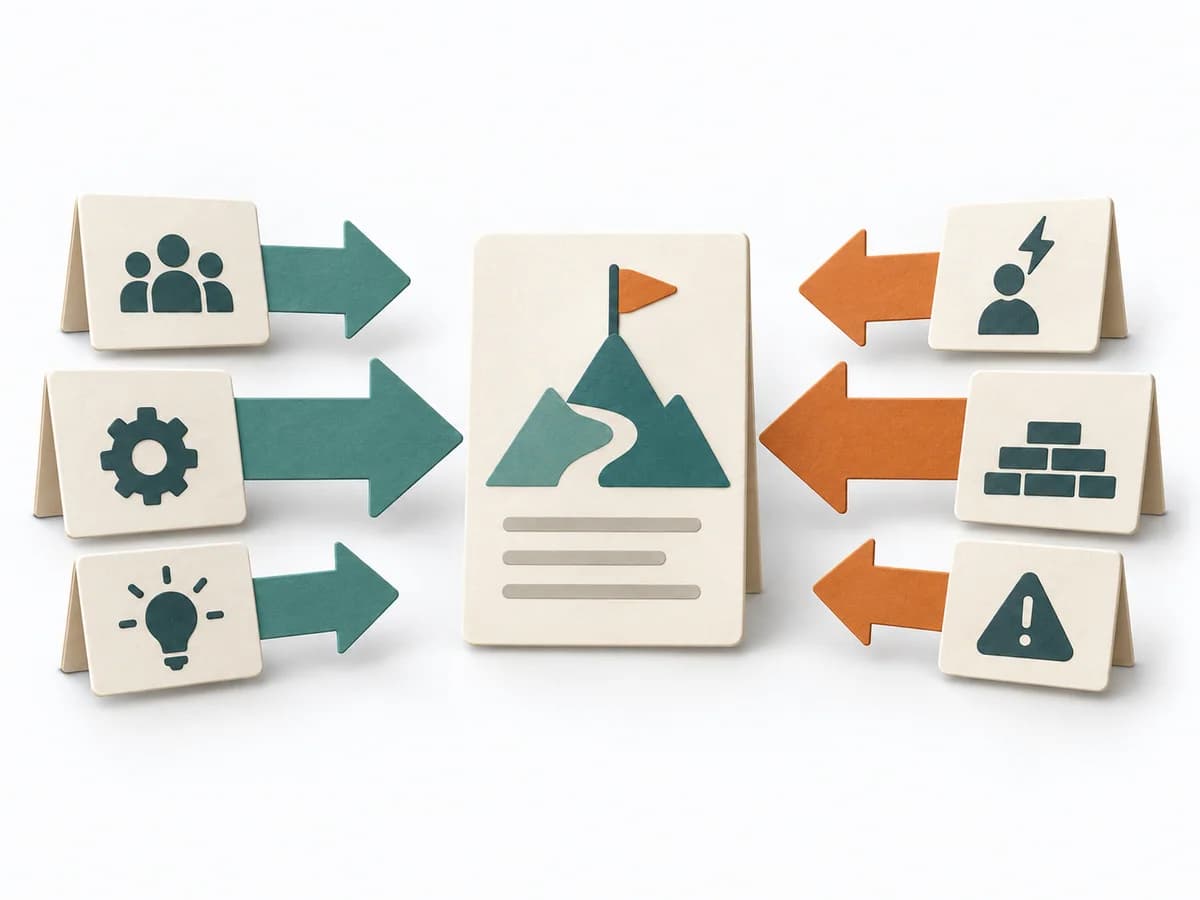 Decision Making Force Field Analysis | 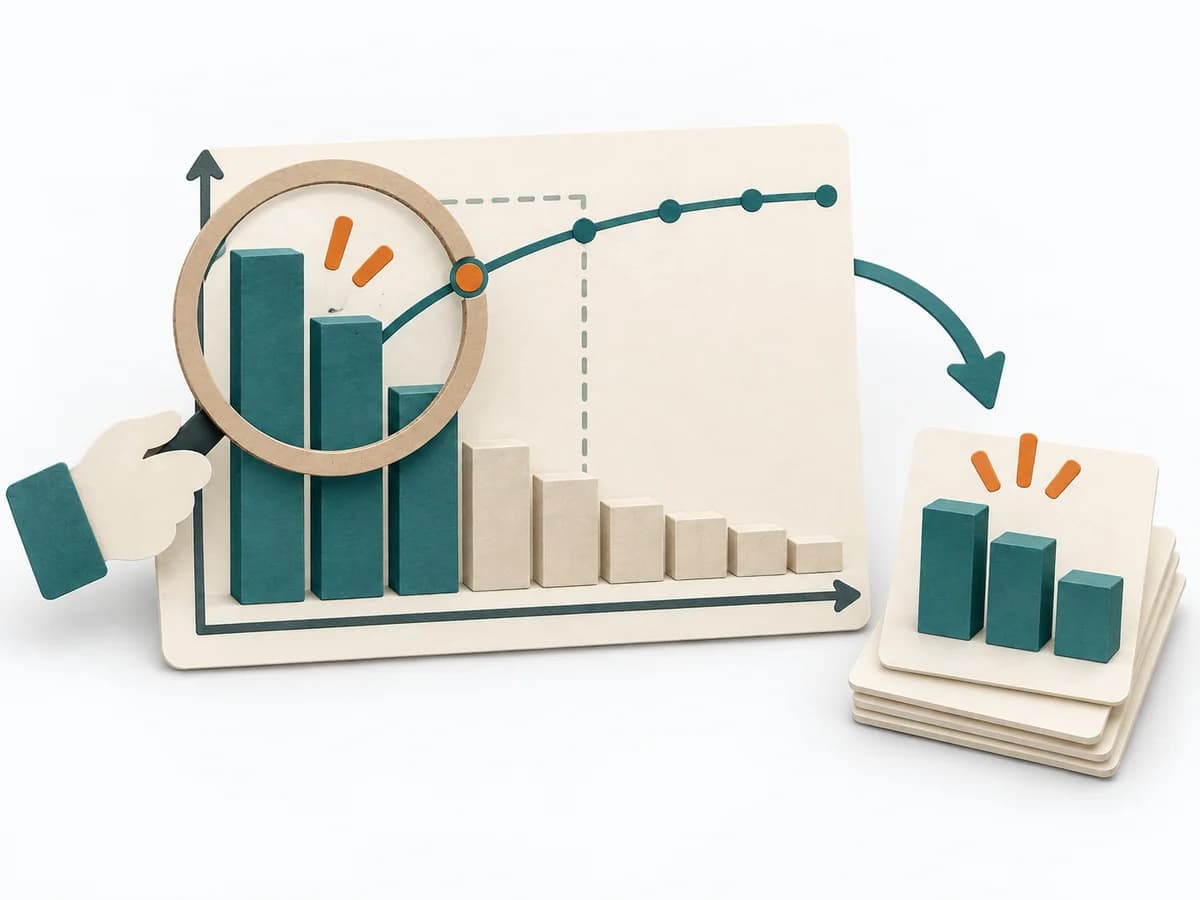 Decision Making Pareto Analysis |  Delivery Cost of Delay |
|---|---|---|---|
Purposedifferent | In change initiatives, supporting and restraining forces sit at the table at the same time. Force Field Analysis makes these tensions explicit and shows where change can be pushed forward by strengthening or relieving. | In many problem situations, effect is distributed unequally across many causes. A Pareto Analysis separates the few drivers with high leverage from the long remainder and focuses attention on what measurably moves the needle. | Helps clarify scope, order, and delivery flow in concrete terms. It makes work, constraints, and sequence manageable. The result is captured as a Cost of Delay table and prioritization sequence. |
Complexitydifferent | Low | Low | High |
Timedifferent | 45-90 min | 30-60 min | 90-180 min |
Participantsdifferent | 3-12 | 1-6 | 3-8 |
Formatdifferent | Workshop | Workshop + async | Workshop |
Outputdifferent | Force Field Map, Change Levers, Risk Notes | Pareto Chart, Top Causes, Focus List | CoD Table, Prioritization Sequence |
Tagsno overlap | ChangeDecisionStrategy | PrioritizationQualityFocusRoot cause | PrioritizationDeliveryEconomicsDecision |
Often compared together
Methods with strong topical overlap with the current selection, not yet in the comparison.