View methods side by side.
Choose up to four methods. Add them using the search and share the comparison by copying its link.
| Criterion |  Growth Flywheel |  Business Strategy McKinsey 7S | 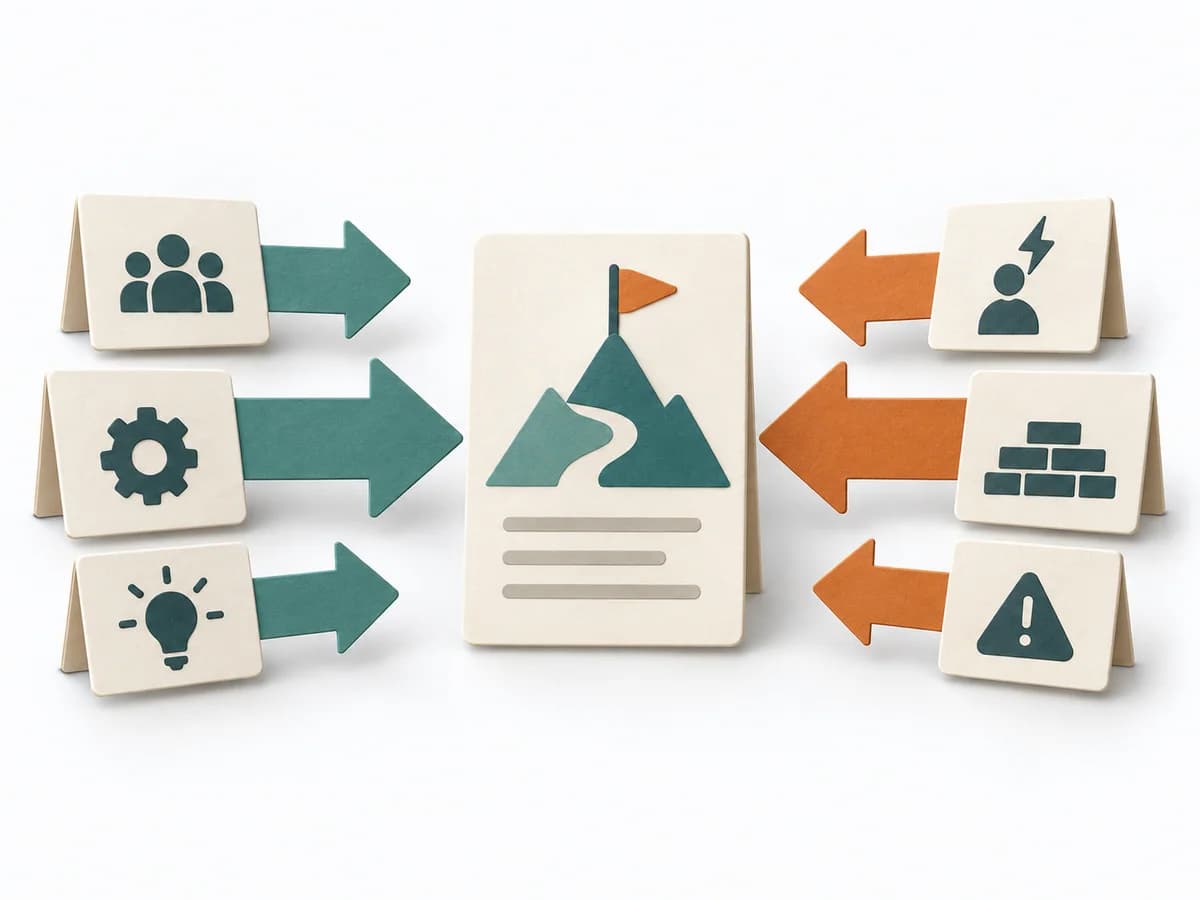 Decision Making Force Field Analysis |
|---|---|---|---|
Purposedifferent | Growth often breaks down where a reinforcing mechanism builds up too much friction. A Flywheel shows the cycle of value, repetition, and reinforcement meant to sustain growth. | McKinsey 7S checks whether Strategy, Structure, Systems, Shared Values, Skills, Style, and Staff fit together. Organizational misalignments become visible across multiple levers as a result. | In change initiatives, supporting and restraining forces sit at the table at the same time. Force Field Analysis makes these tensions explicit and shows where change can be pushed forward by strengthening or relieving. |
Complexitydifferent | Medium | Medium | Low |
Timedifferent | 60-120 min | 2-4 h | 45-90 min |
Participantsdifferent | 3-8 | 3-12 | 3-12 |
Formatsame | Workshop | Workshop | Workshop |
Outputdifferent | Flywheel Map, Friction Points, Growth Levers, Experiment Backlog | 7S Assessment, Alignment Gaps, Change Actions | Force Field Map, Change Levers, Risk Notes |
Tagsno overlap | GrowthRetentionConversion | OrganizationStrategyAlignmentChange | ChangeDecisionStrategy |
Often compared together
Methods with strong topical overlap with the current selection, not yet in the comparison.