View methods side by side.
Choose up to four methods. Add them using the search and share the comparison by copying its link.
| Criterion | 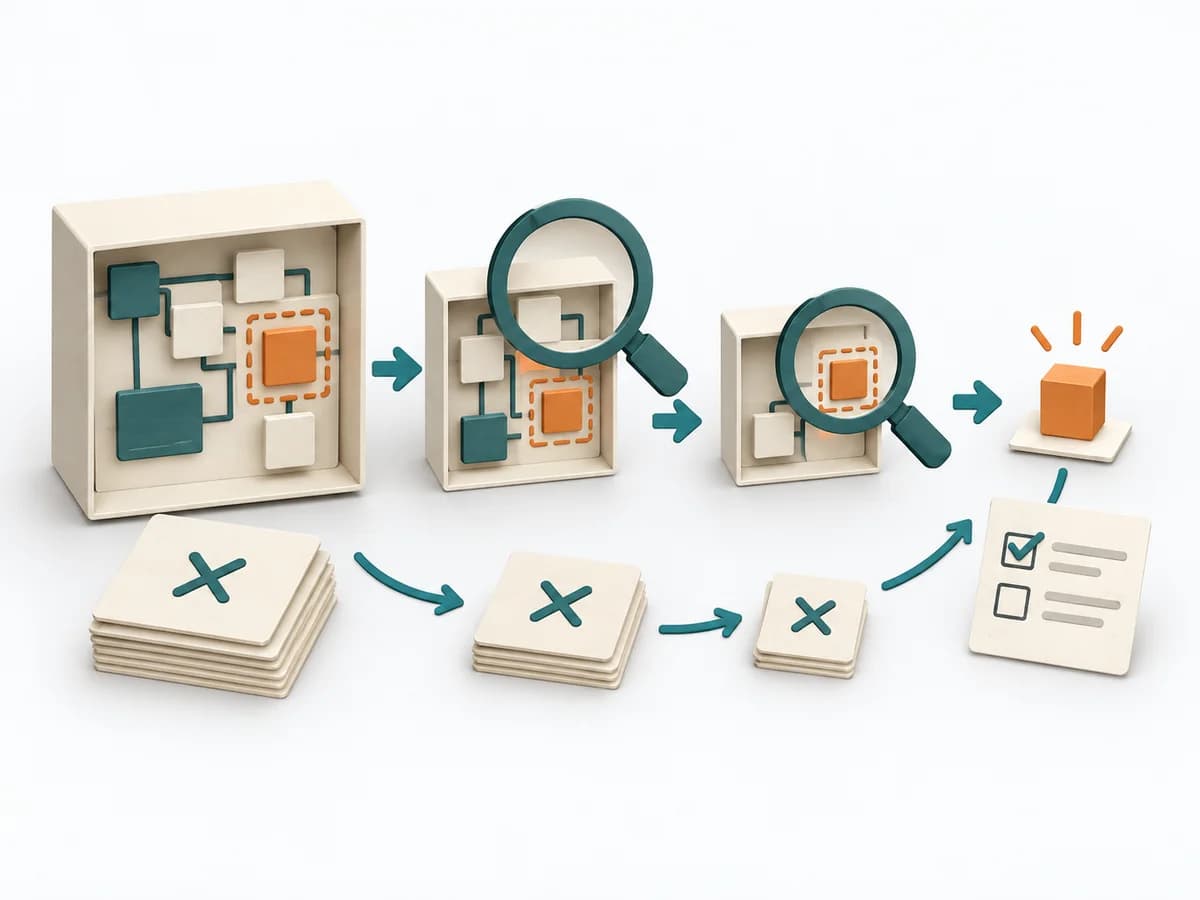 Engineering Fault Isolation |  Operations Kepner-Tregoe |  Operations Root Cause Analysis |
|---|---|---|---|
Purposedifferent | In technical failures, the visible symptom often gets mixed up with the actual cause. Fault Isolation narrows the fault space and progressively reduces which part of the system is truly affected. | For a disturbance that's hard to pin down, the method cleanly separates problem, cause, and decision. It reduces mixing when symptoms allow several interpretations. | When a problem keeps recurring and the cause stays unclear, the method exposes the underlying mechanism. It separates symptom, guess, and robust explanation from one another. |
Complexitydifferent | Medium | High | Medium |
Timedifferent | 30-180 min | 2-8 h | 1-4 h |
Participantsdifferent | 1-6 | 2-8 | 3-8 |
Formatsame | Workshop + async | Workshop + async | Workshop + async |
Outputdifferent | Fault Isolation Map, Test Log, Excluded Hypotheses, Narrowed Fault Area | Problem Analysis, Decision Analysis, Risk Plan | Problem Statement, Cause Hypotheses, Confirmed Causes, Action Plan |
Tagsno overlap | TroubleshootingDiagnosisEngineering | Problem solvingRoot causeDecisionOperations | Root causeProblem solvingQualityIncident |
Often compared together
Methods with strong topical overlap with the current selection, not yet in the comparison.



