View methods side by side.
Choose up to four methods. Add them using the search and share the comparison by copying its link.
| Criterion |  Facilitation Expectation Mapping | 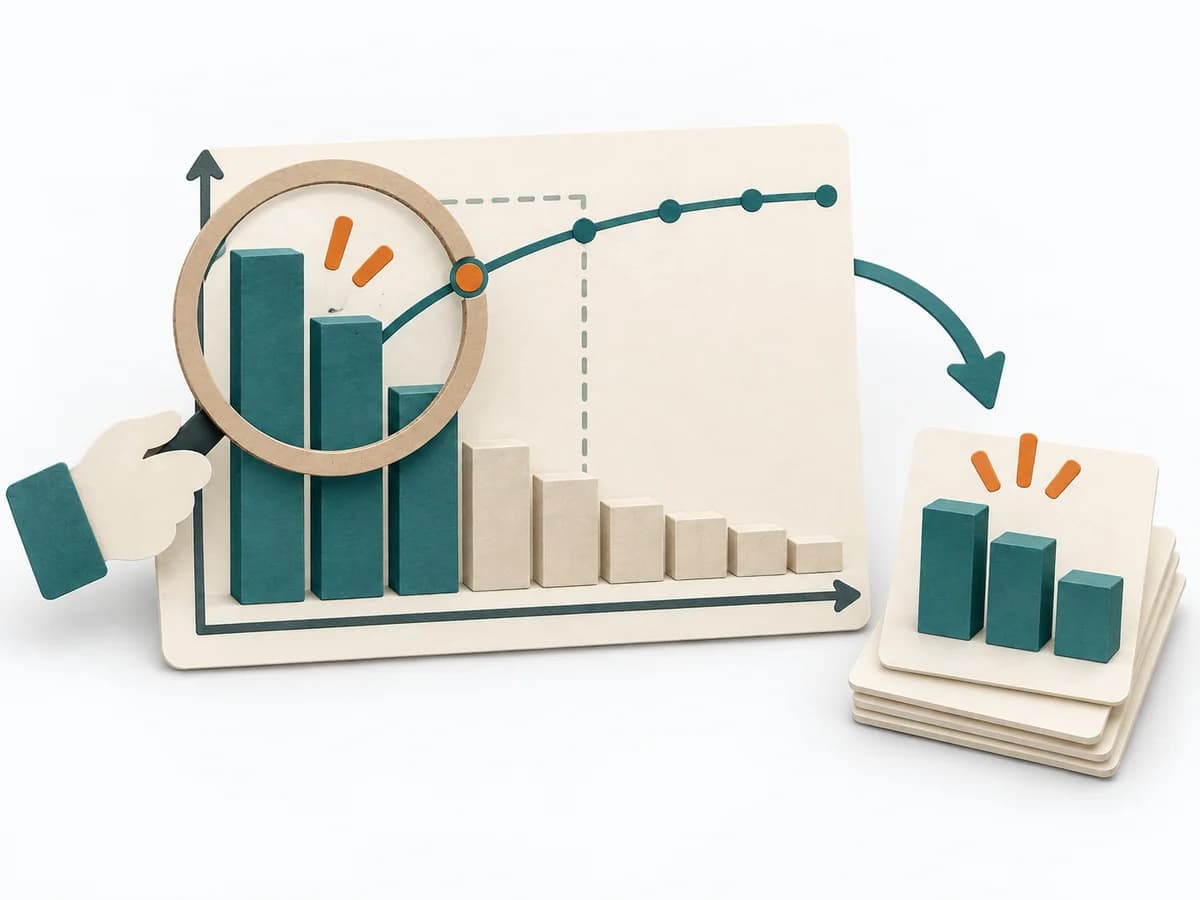 Decision Making Pareto Analysis |  Facilitation Stakeholder Mapping |
|---|---|---|---|
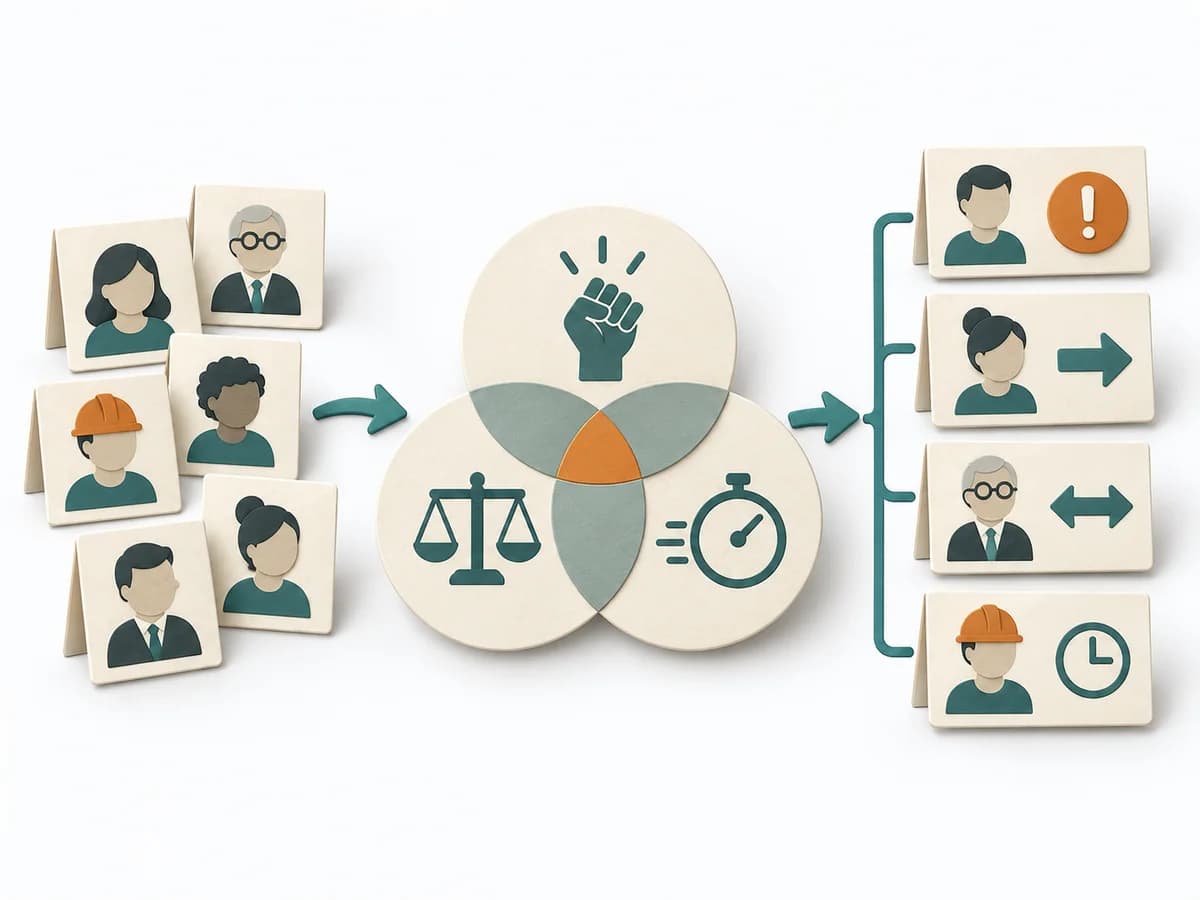
Purposedifferent | When roles, interfaces, or projects fail because of differing expectations, Expectation Mapping surfaces these differences. It shows what each side takes for granted and where the pictures diverge. | In many problem situations, effect is distributed unequally across many causes. A Pareto Analysis separates the few drivers with high leverage from the long remainder and focuses attention on what measurably moves the needle. | When an initiative depends on many people, interests, and power dynamics, Stakeholder Mapping systematically orders the environment. It shows who influences, who is affected, and where relationship management or safeguarding matters first. |
Complexitysame | Low | Low | Low |
Timedifferent | 45-90 min | 30-60 min | 60–90 min |
Participantsdifferent | 3-12 | 1-6 | 2-8 |
Formatdifferent | Workshop | Workshop + async | Workshop + async |
Outputdifferent | Expectation Map, Alignment Notes, Agreements | Pareto Chart, Top Causes, Focus List | Stakeholder Map, Engagement Plan, Risk Notes |
Tagsno overlap | AlignmentStakeholdersTeam | PrioritizationQualityFocusRoot cause | StakeholdersAlignmentFacilitationChange |
Often compared together
Methods with strong topical overlap with the current selection, not yet in the comparison.