View methods side by side.
Choose up to four methods. Add them using the search and share the comparison by copying its link.
| Criterion |  Facilitation Expectation Mapping | 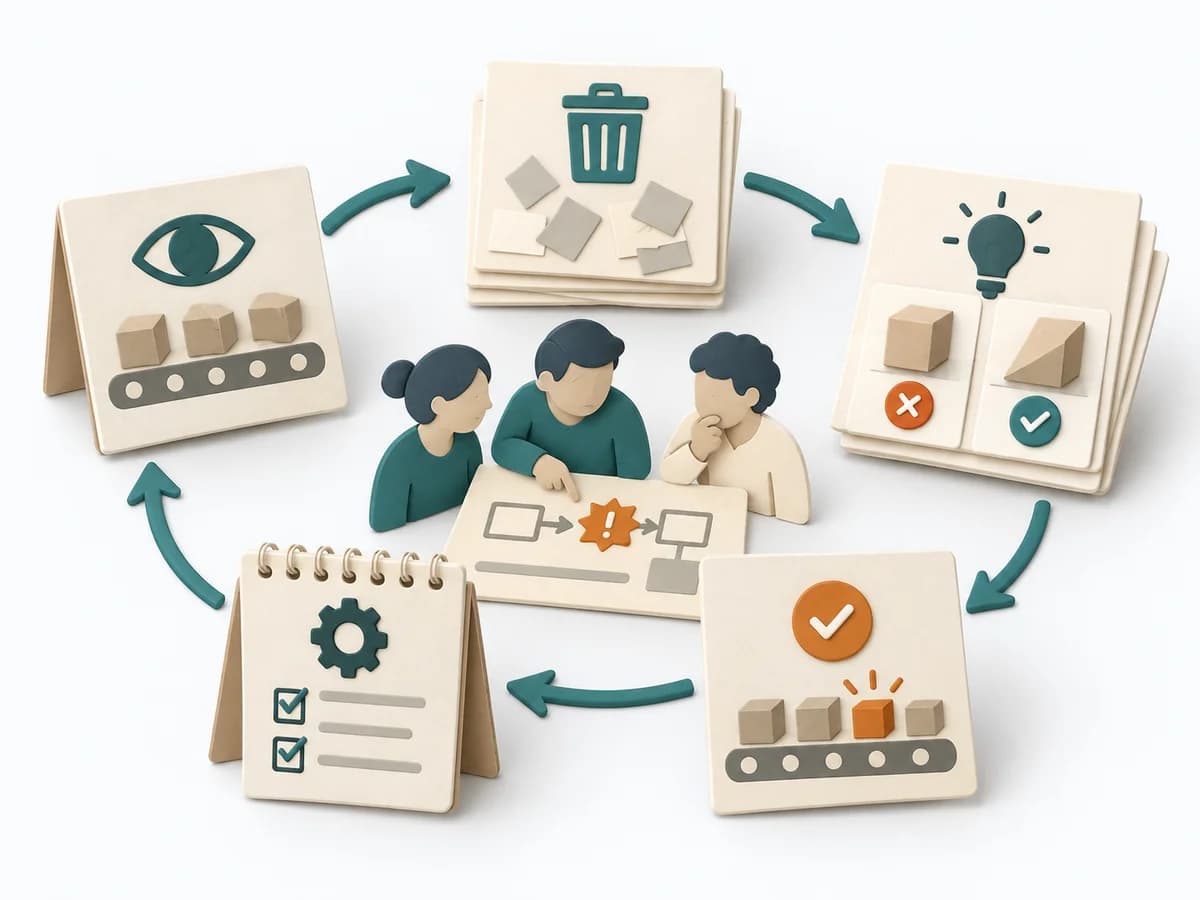 Operations Kaizen Event |  Operations Failure Mode and Effects Analysis |
|---|---|---|---|
Purposedifferent | When roles, interfaces, or projects fail because of differing expectations, Expectation Mapping surfaces these differences. It shows what each side takes for granted and where the pictures diverge. | For a tightly scoped process segment with noticeable waste, the method bundles shared energy for change. It suits situations that call for fast learning loops and visible adjustments. | For a process, product, or service with noticeable failure risks, the method assesses possible failure modes in advance. It directs attention to combinations of occurrence, effect, and detectability. |
Complexitydifferent | Low | Medium | High |
Timedifferent | 45-90 min | 0.5-5 Tage | 2-6 h |
Participantsdifferent | 3-12 | 4-10 | 3-10 |
Formatsame | Workshop | Workshop | Workshop |
Outputdifferent | Expectation Map, Alignment Notes, Agreements | Kaizen Charter, Waste List, Improvement Experiments, Standard Work Update | FMEA Table, Risk Priority, Mitigation Actions |
Tagsno overlap | AlignmentStakeholdersTeam | LeanContinuous improvementOperations | RiskQualityOperationsRoot cause |
Often compared together
Methods with strong topical overlap with the current selection, not yet in the comparison.