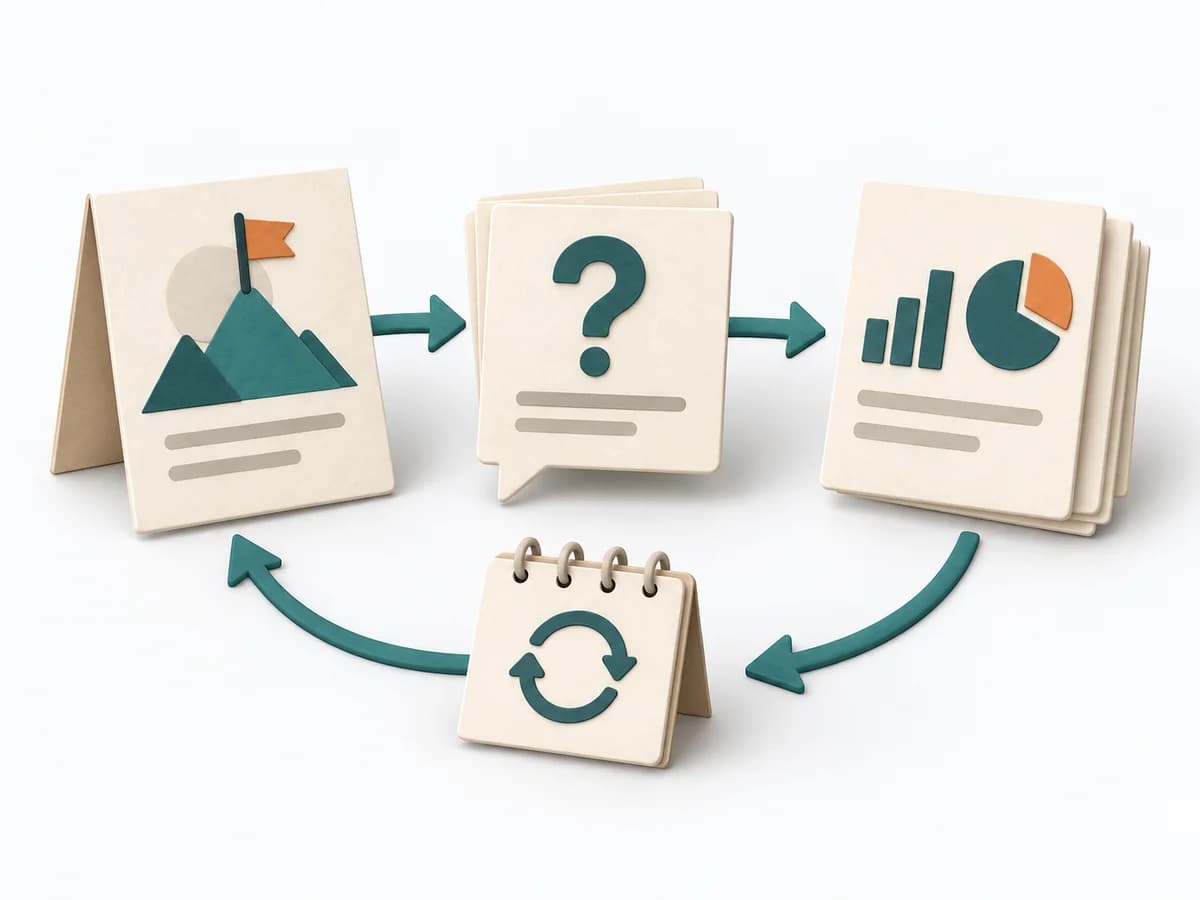
View methods side by side.
Choose up to four methods. Add them using the search and share the comparison by copying its link.
| Criterion | 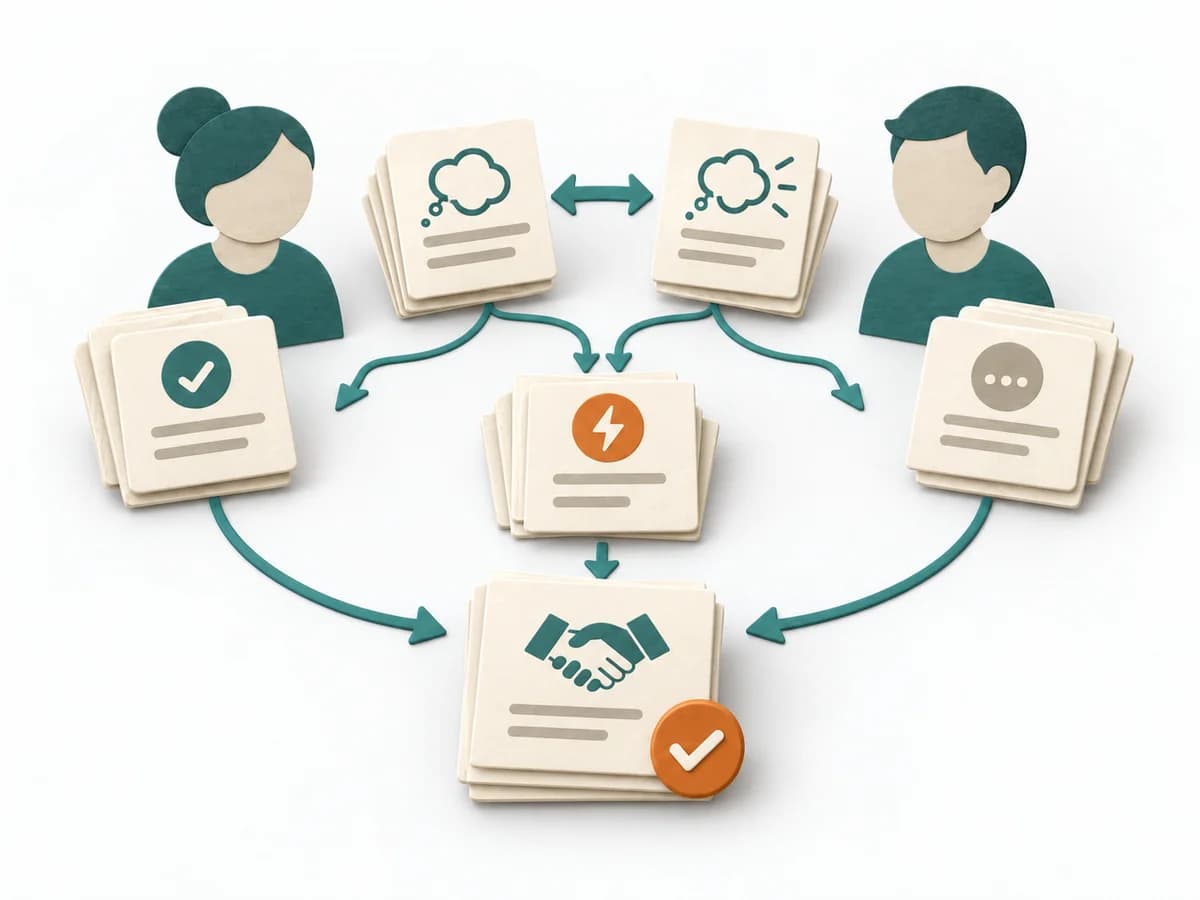 Facilitation Expectation Mapping | 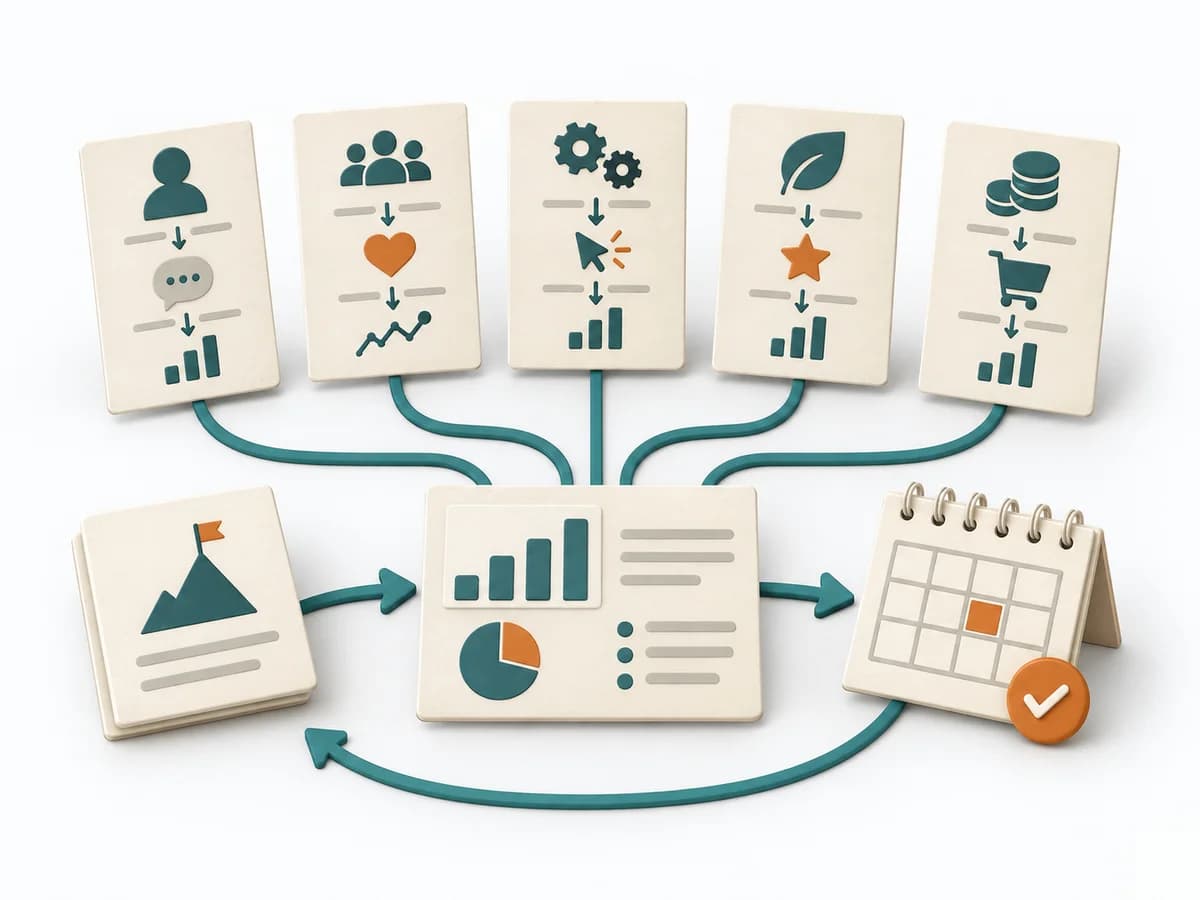 UX Research HEART Framework |  Product Strategy KPI Tree |
|---|---|---|---|
Purposedifferent | When roles, interfaces, or projects fail because of differing expectations, Expectation Mapping surfaces these differences. It shows what each side takes for granted and where the pictures diverge. | Helps clarify observations, needs, and patterns in concrete terms. It groups observations into patterns, questions, and decisions. The result is captured as a HEART-GSM table and dashboard. | When metrics across the organization drift apart, it arranges drivers and effects under one shared logic. It connects customer value, product logic, and decision priorities. The result is captured as a KPI tree and owner list. |
Complexitydifferent | Low | Medium | Medium |
Timedifferent | 45-90 min | 120 min initial, dann laufend | 90-180 min initial, dann laufend |
Participantsdifferent | 3-12 | 3-6 | 3-8 |
Formatdifferent | Workshop | Workshop + async | Workshop + async |
Outputdifferent | Expectation Map, Alignment Notes, Agreements | HEART-GSM Table, Dashboard | KPI Tree, Owner List |
Tagsno overlap | AlignmentStakeholdersTeam | MetricsUX researchMeasurementSatisfaction | MetricsStrategyAlignmentMeasurement |
Often compared together
Methods with strong topical overlap with the current selection, not yet in the comparison.