View methods side by side.
Choose up to four methods. Add them using the search and share the comparison by copying its link.
| Criterion |  Systems Thinking Evaporating Cloud | 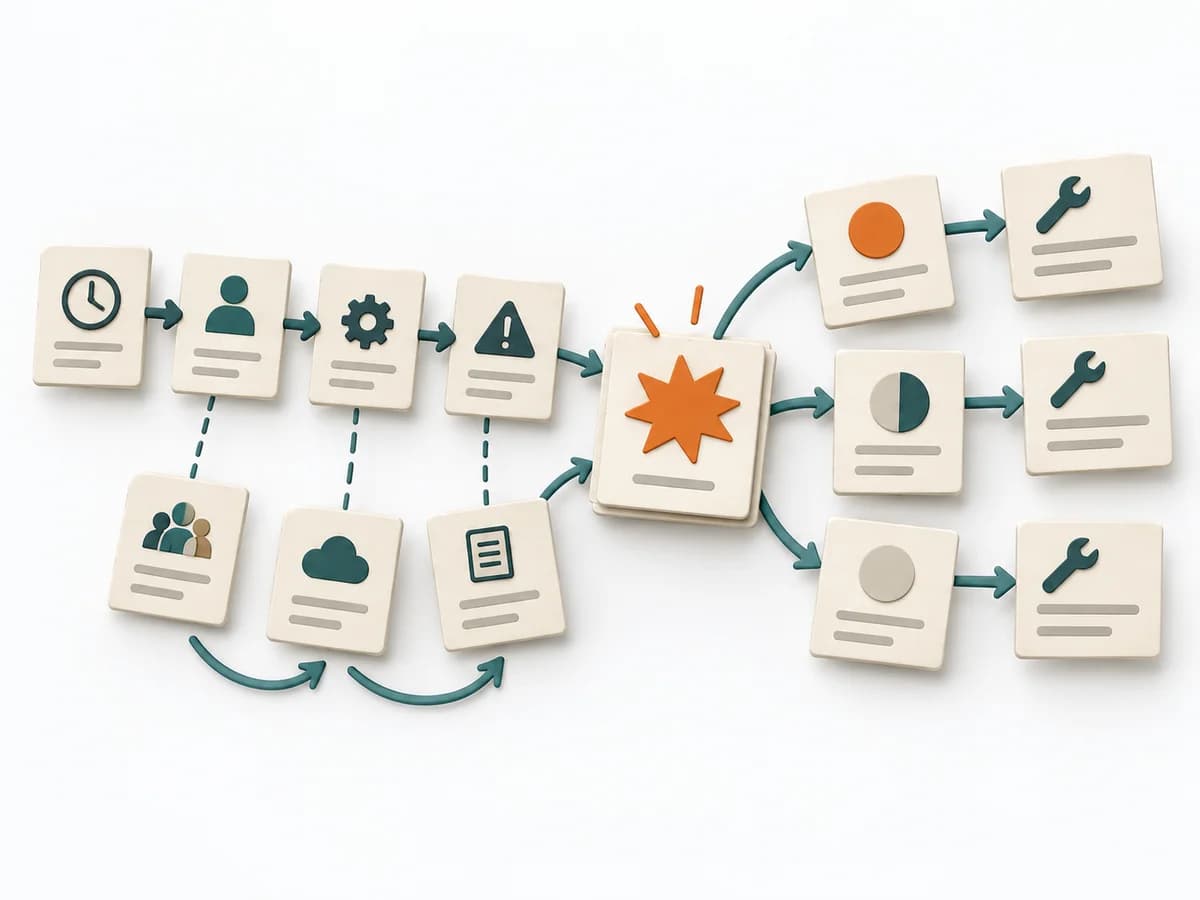 Operations Causal Factor Analysis |  Systems Thinking Causal Loop Diagram |
|---|---|---|---|
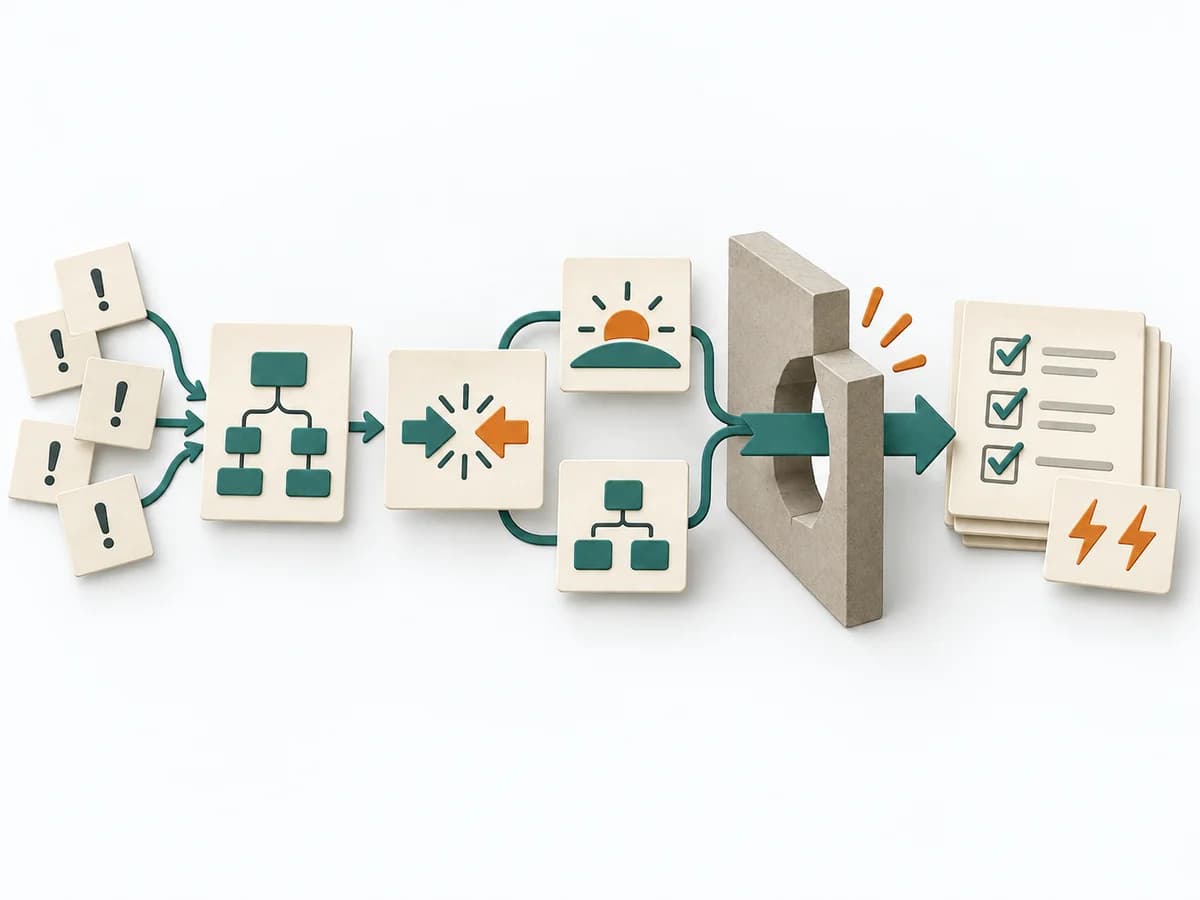
Purposedifferent | The method makes visible why two seemingly incompatible demands arise and which assumption must be tested to resolve the conflict. | For an event with a complicated course, the method breaks down the contributing factors along the timeline. It shows how conditions, decisions, and reactions together produce a course of events. | A Causal Loop Diagram makes feedback, reinforcement, and balance in a system legible. It uncovers side effects and self-reinforcement that stay hidden in linear explanations. |
Complexitydifferent | Medium | High | Medium |
Timedifferent | 60-120 min | 2-6 h | 1-3 h |
Participantsdifferent | 2-8 | 3-10 | 2-8 |
Formatdifferent | Workshop | Workshop + async | Workshop |
Outputdifferent | Conflict Cloud, Assumption List, Breakthrough Ideas, Next Experiments | Event Timeline, Causal Factor Chart, Cause List, Corrective Actions | Causal Loop Diagram, Feedback Notes, Leverage Points |
Tagsno overlap | Theory of ConstraintsAssumptionsSystems thinking | CausalityIncidentRoot causeTimeline | FeedbackSystems thinkingCausalityDynamics |
Often compared together
Methods with strong topical overlap with the current selection, not yet in the comparison.