View methods side by side.
Choose up to four methods. Add them using the search and share the comparison by copying its link.
| Criterion |  Facilitation Dot Estimation | 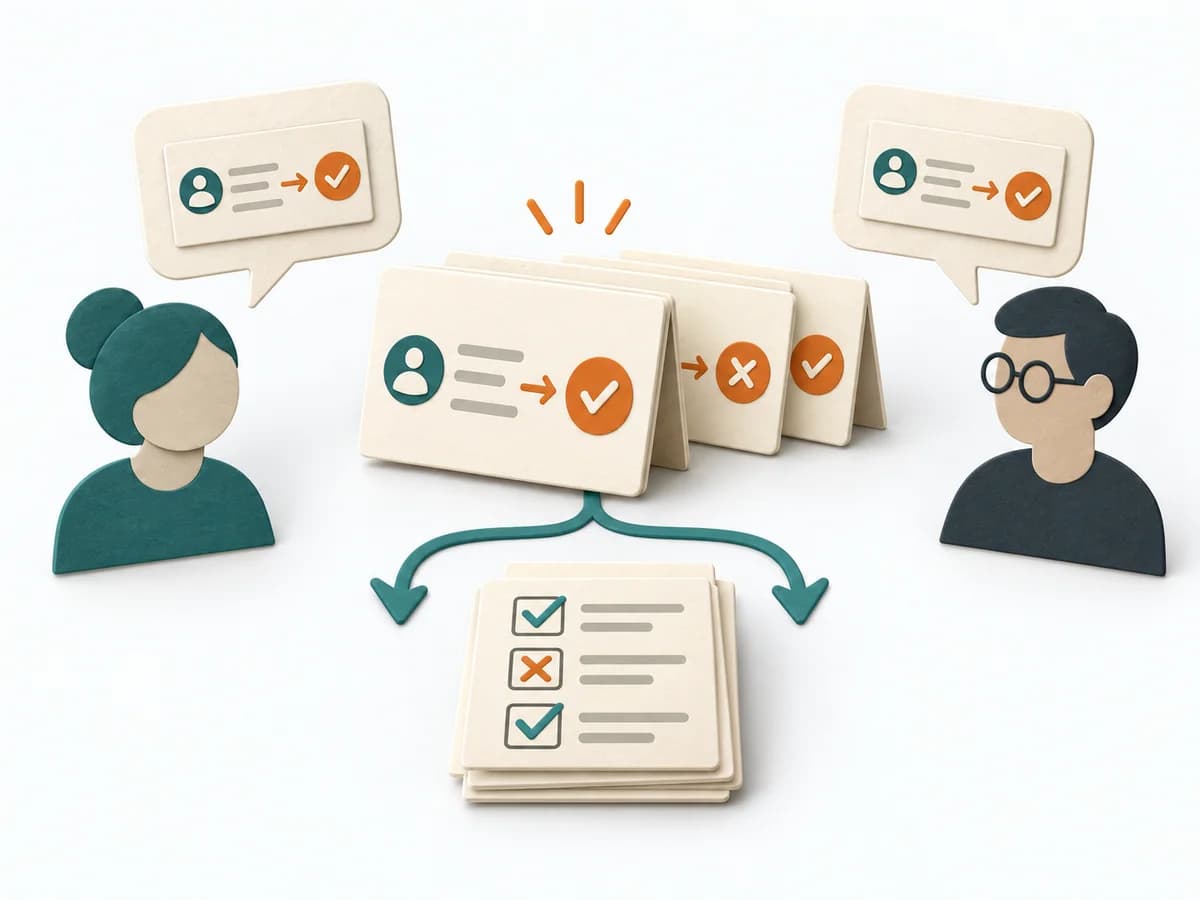 Agile Specification by Example |  Operations Fishbone Diagram |
|---|---|---|---|
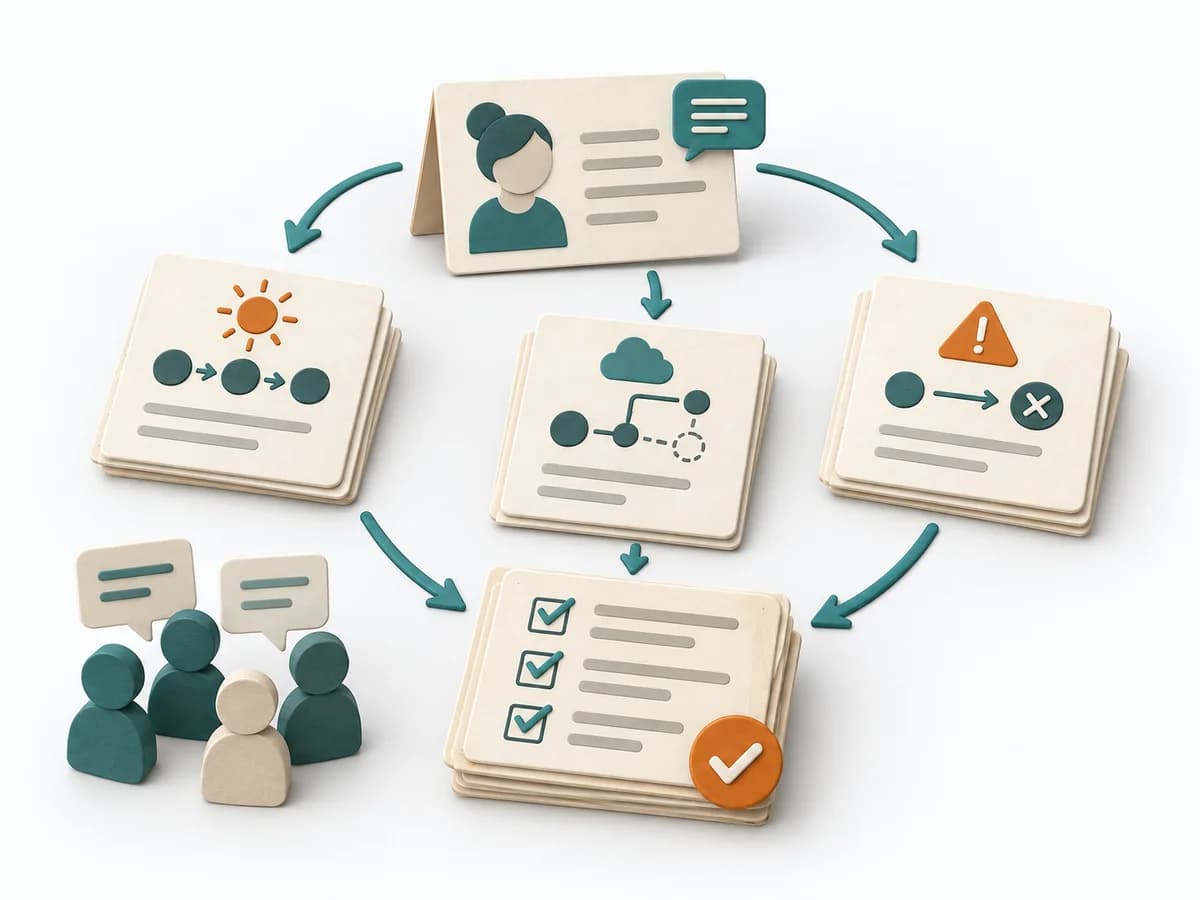
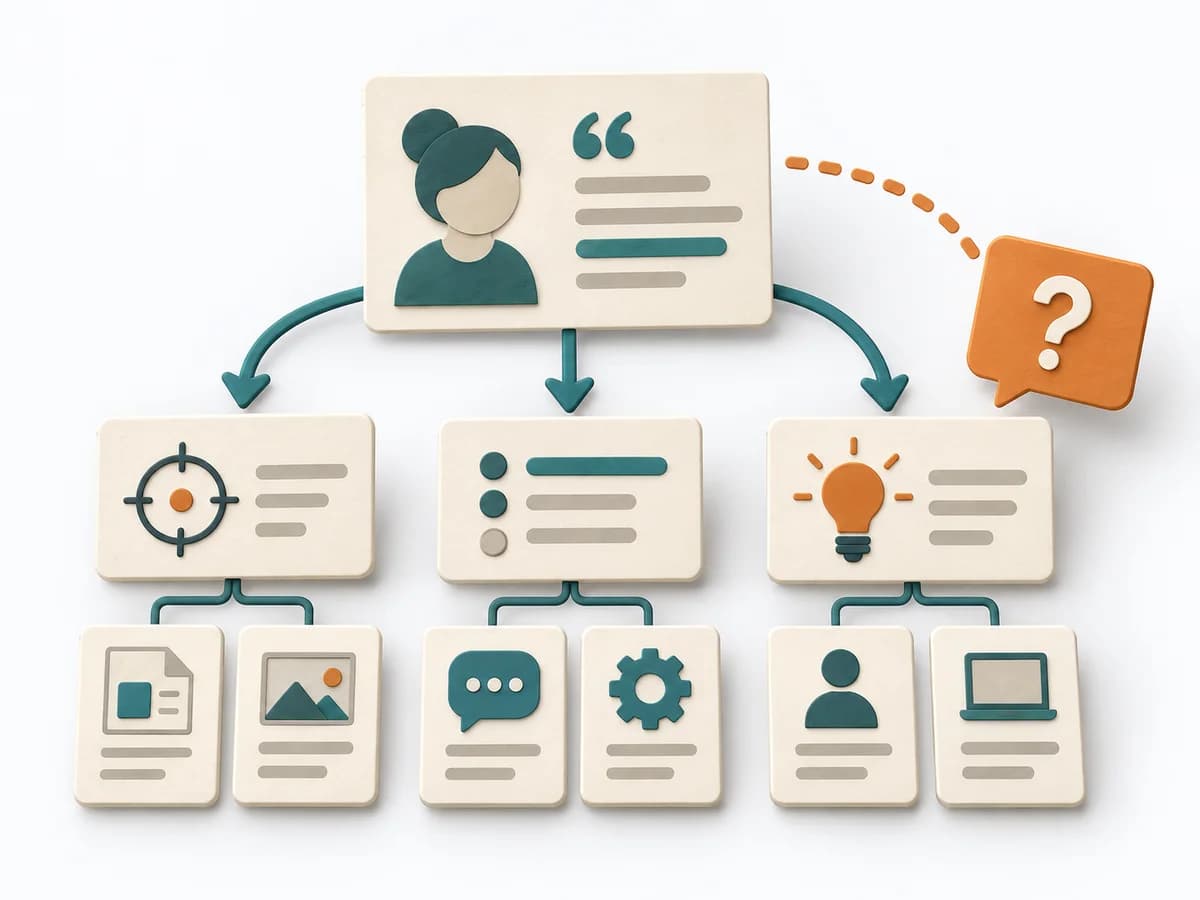
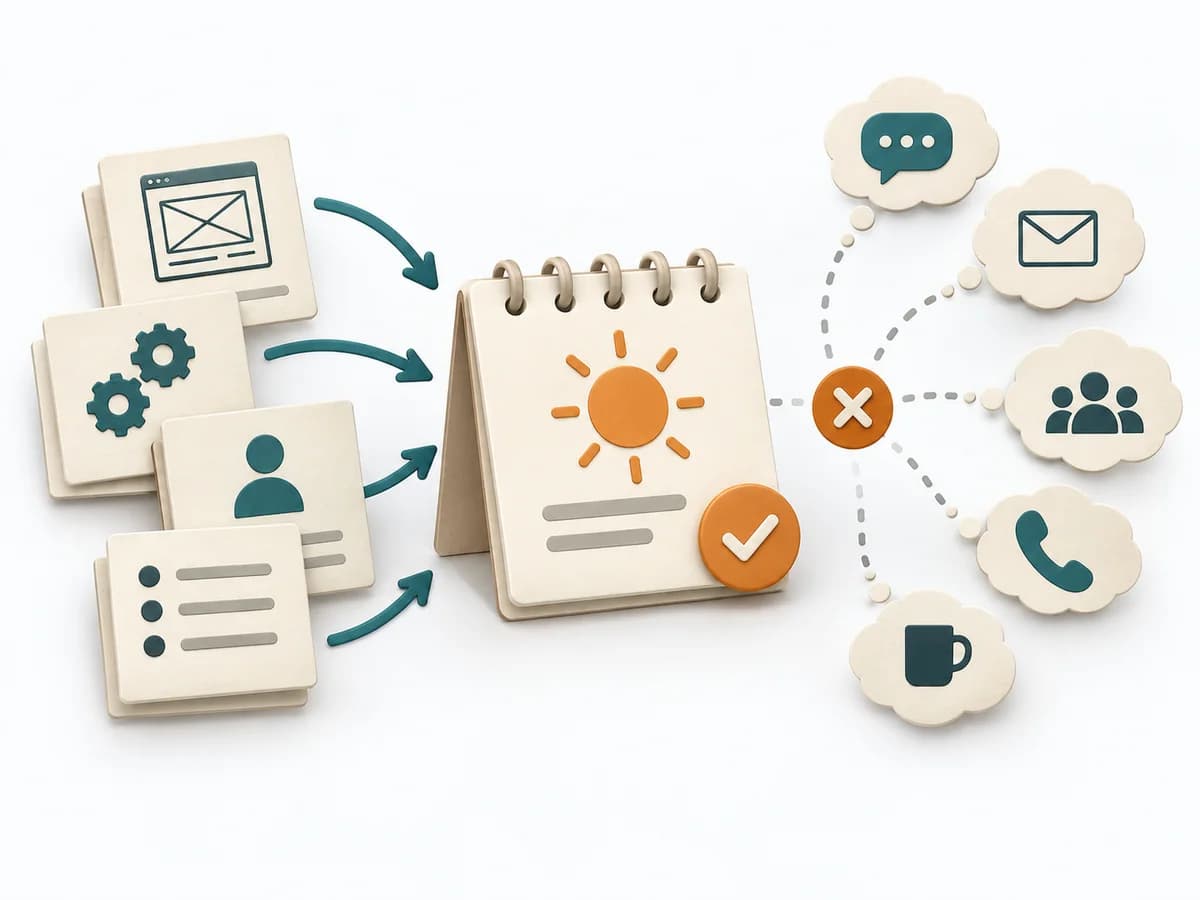
Purposedifferent | When size or effort can only be estimated roughly, Dot Estimation condenses the group's experience into a quick range. It turns individual contributions into a visible selection. The result is captured as an Effort Heatmap, Risk Signals, and Discussion Targets. | When business rules need to become precise, it ties language, example, and test together. It sorts work by value, risk, and delivery ability. The result is captured as an Example Table and Acceptance Tests. | When a problem has several possible contributing factors, the method sorts causes by cause areas. It prevents an initial hunch from blocking the view of other plausible drivers. |
Complexitydifferent | Low | Medium | Low |
Timedifferent | 5-20 min | 60-90 min pro Feature | 30-60 min |
Participantsdifferent | 3-20 | 3-6 | 2-8 |
Formatsame | Workshop | Workshop | Workshop |
Outputdifferent | Effort Heatmap, Risk Signals, Discussion Targets | Example Table, Acceptance Tests | Fishbone Diagram, Cause Categories, Investigation Backlog |
Tagsno overlap | EstimationEffortRisk | AgileRequirementsExamplesBehavior-Driven Development | Root causeQualityOperations |
Often compared together
Methods with strong topical overlap with the current selection, not yet in the comparison.