View methods side by side.
Choose up to four methods. Add them using the search and share the comparison by copying its link.
| Criterion |  Facilitation Dot Estimation |  Business Strategy GAP Analysis |  Growth Flywheel |
|---|---|---|---|
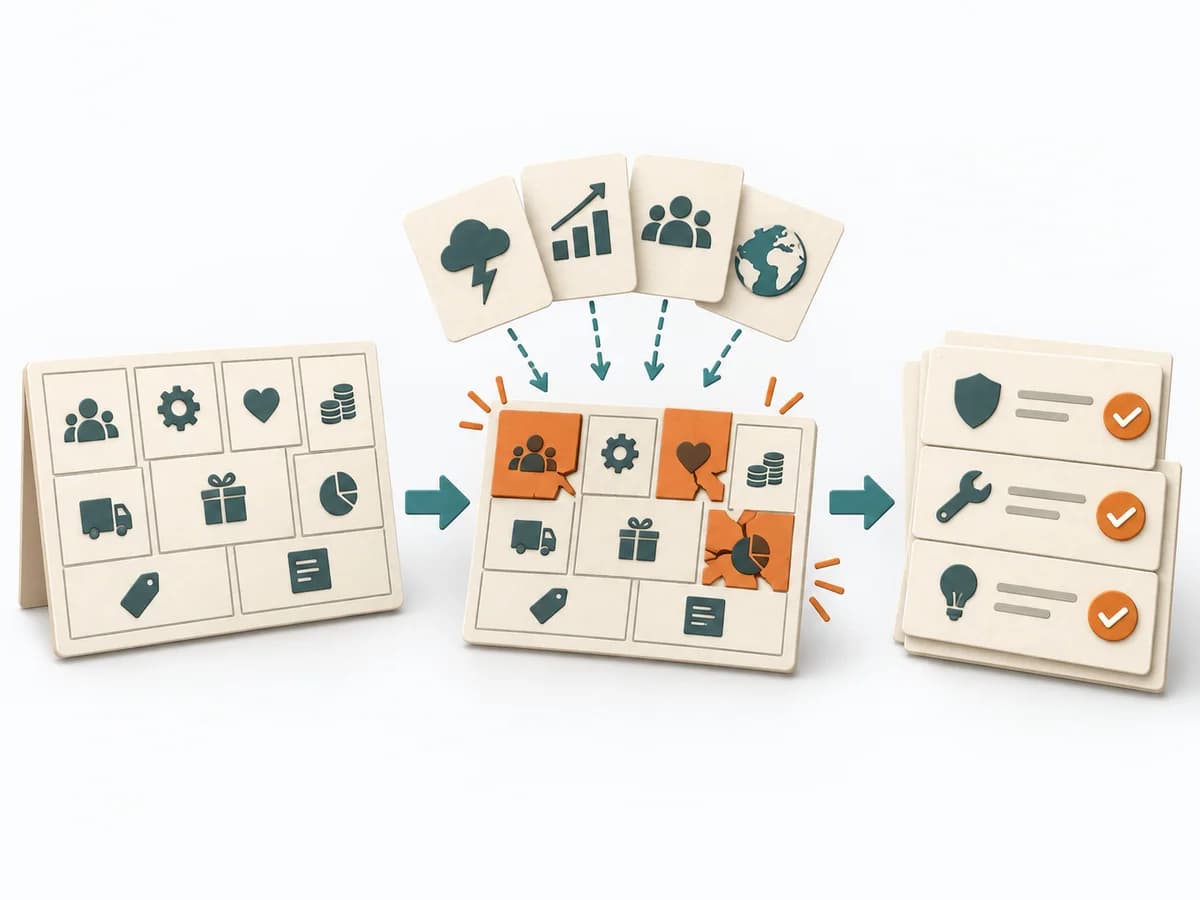
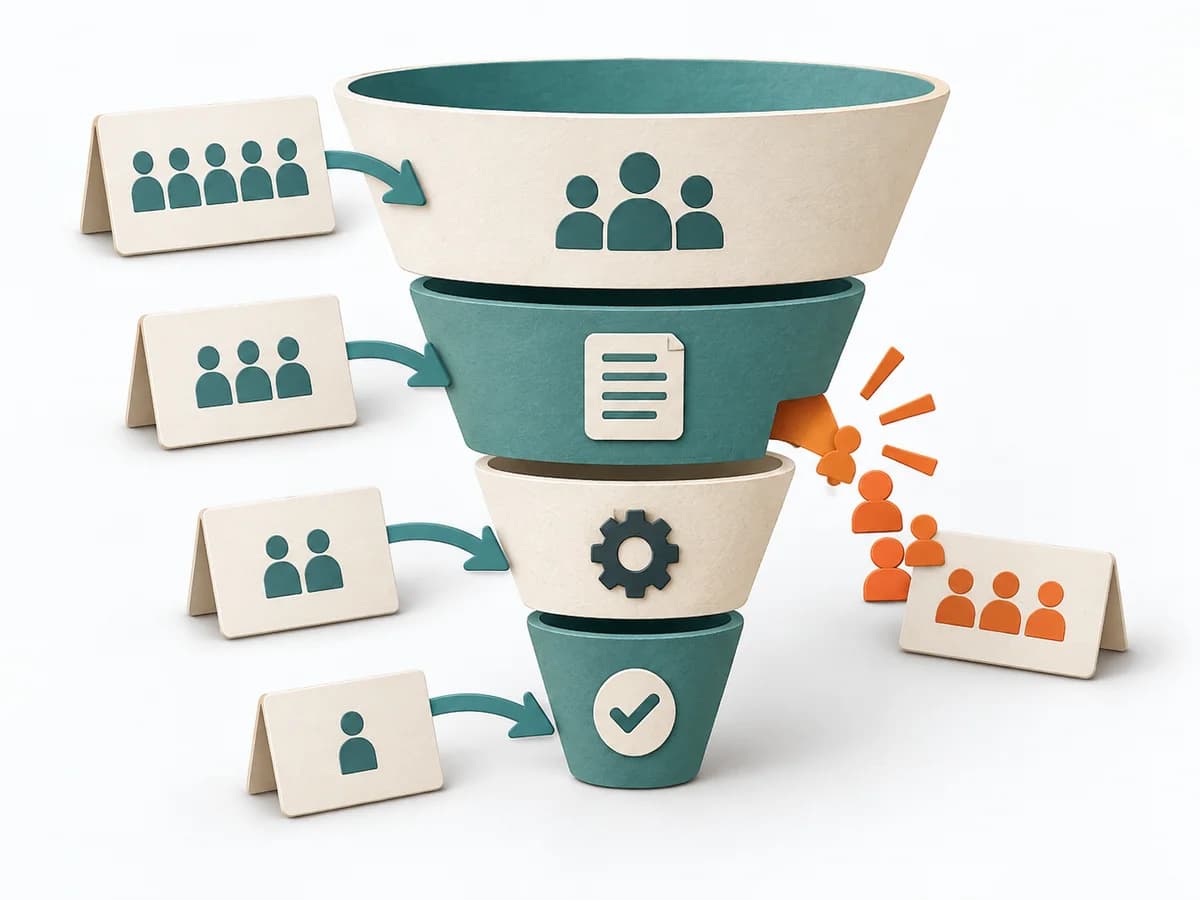
Purposedifferent | When size or effort can only be estimated roughly, Dot Estimation condenses the group's experience into a quick range. It turns individual contributions into a visible selection. The result is captured as an Effort Heatmap, Risk Signals, and Discussion Targets. | GAP Analysis compares the current state with a target picture and makes the distance manageable. It becomes useful when, ahead of new initiatives, it must become clear which capabilities, processes, or resources are missing. | Growth often breaks down where a reinforcing mechanism builds up too much friction. A Flywheel shows the cycle of value, repetition, and reinforcement meant to sustain growth. |
Complexitydifferent | Low | Medium | Medium |
Timedifferent | 5-20 min | 1-3 h | 60-120 min |
Participantsdifferent | 3-20 | 2-8 | 3-8 |
Formatdifferent | Workshop | Workshop + async | Workshop |
Outputdifferent | Effort Heatmap, Risk Signals, Discussion Targets | Gap Matrix, Action Plan, Risk Notes | Flywheel Map, Friction Points, Growth Levers, Experiment Backlog |
Tagsno overlap | EstimationEffortRisk | StrategyAnalysisPlanning | GrowthRetentionConversion |
Often compared together
Methods with strong topical overlap with the current selection, not yet in the comparison.