View methods side by side.
Choose up to four methods. Add them using the search and share the comparison by copying its link.
| Criterion | 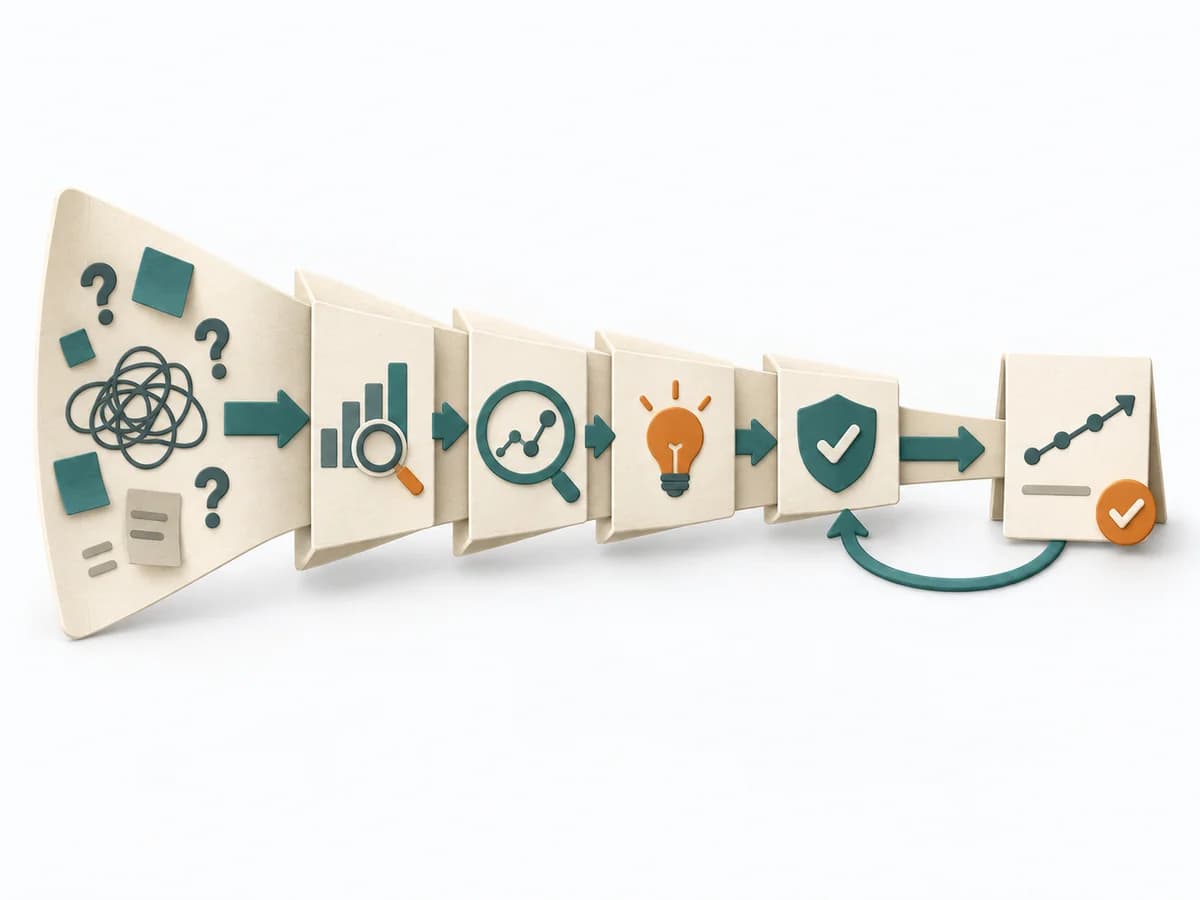 Operations DMAIC | 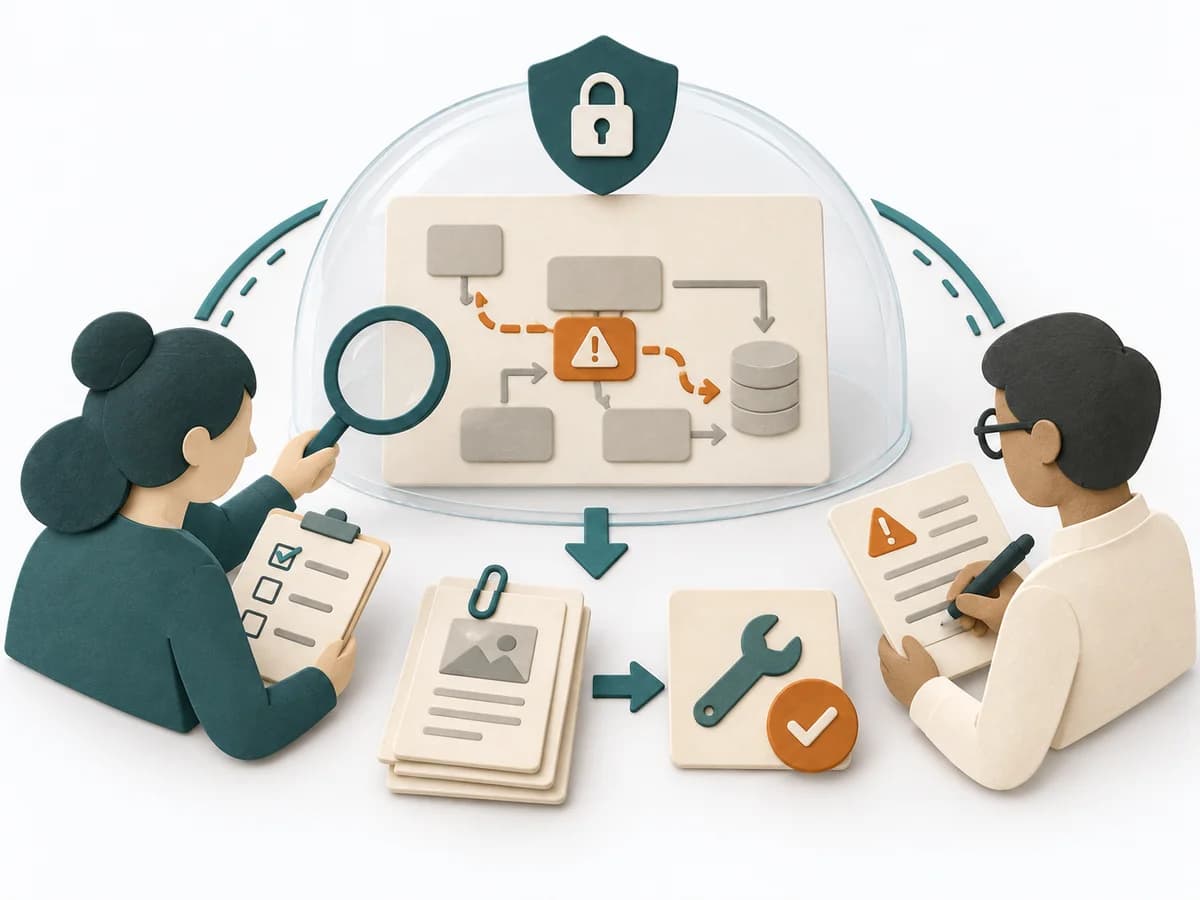 Decision Making Red Teaming | 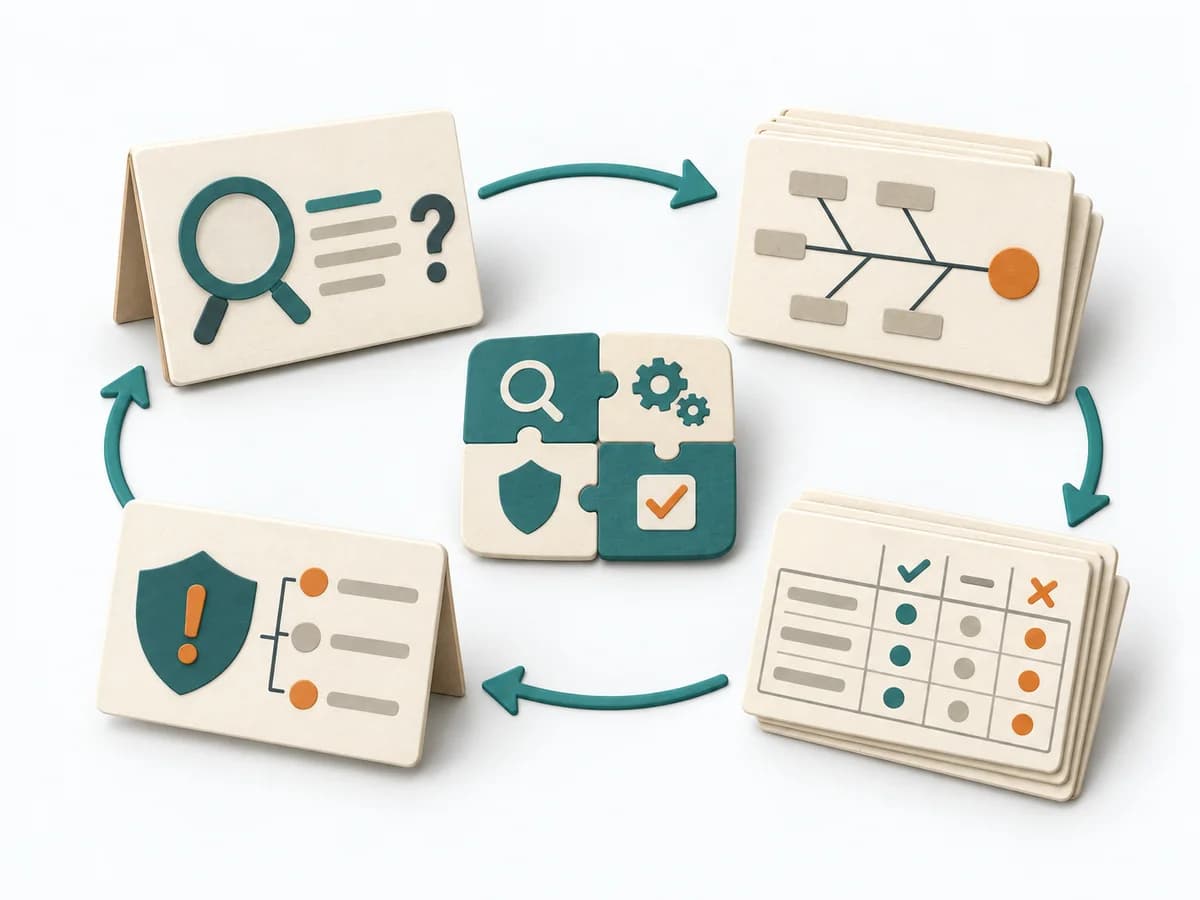 Operations Kepner-Tregoe |
|---|---|---|---|
Purposedifferent | For a process problem with fluctuating performance, the method brings analysis and improvement into a disciplined sequence. It creates a framework in which numbers, causes, and control come together. | For strategic decisions with high reach, agreement and gut feeling are often not enough. Red teaming brings deliberate opposition into the situation and tests where a plan breaks under real counterarguments. | For a disturbance that's hard to pin down, the method cleanly separates problem, cause, and decision. It reduces mixing when symptoms allow several interpretations. |
Complexitysame | High | High | High |
Timedifferent | 2-12 Wochen | 1-4 h | 2-8 h |
Participantsdifferent | 3-10 | 3-8 | 2-8 |
Formatdifferent | Workshop + async | Workshop | Workshop + async |
Outputdifferent | Project Charter, Measurement Plan, Cause Analysis, Control Plan | Challenge Findings, Risk Register, Mitigation Plan | Problem Analysis, Decision Analysis, Risk Plan |
Tagsno overlap | Continuous improvementQualityProcess improvement | RiskDecisionSensemaking | Problem solvingRoot causeDecisionOperations |
Often compared together
Methods with strong topical overlap with the current selection, not yet in the comparison.



