View methods side by side.
Choose up to four methods. Add them using the search and share the comparison by copying its link.
| Criterion | 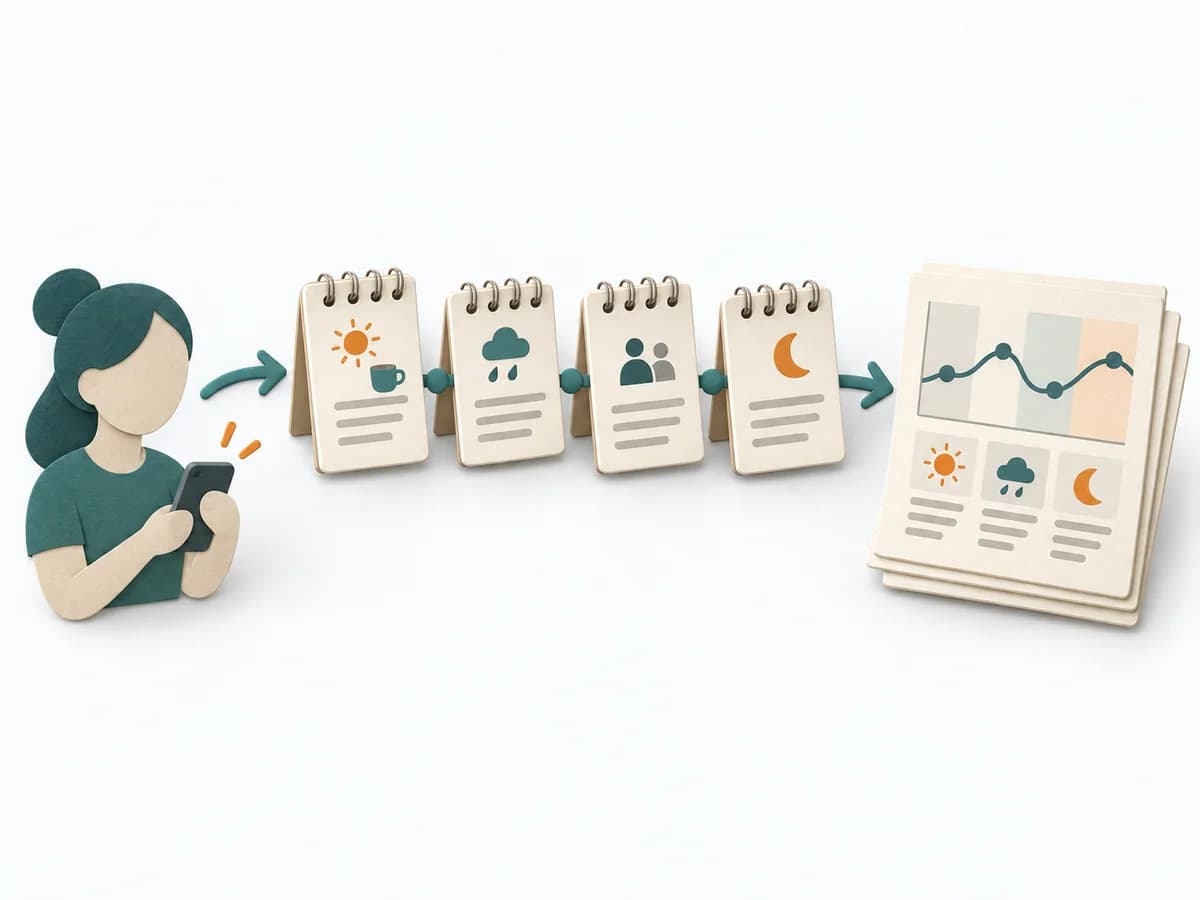 UX Research Diary Study |  Knowledge Modeling Event Modeling |  Operations Failure Mode and Effects Analysis |
|---|---|---|---|
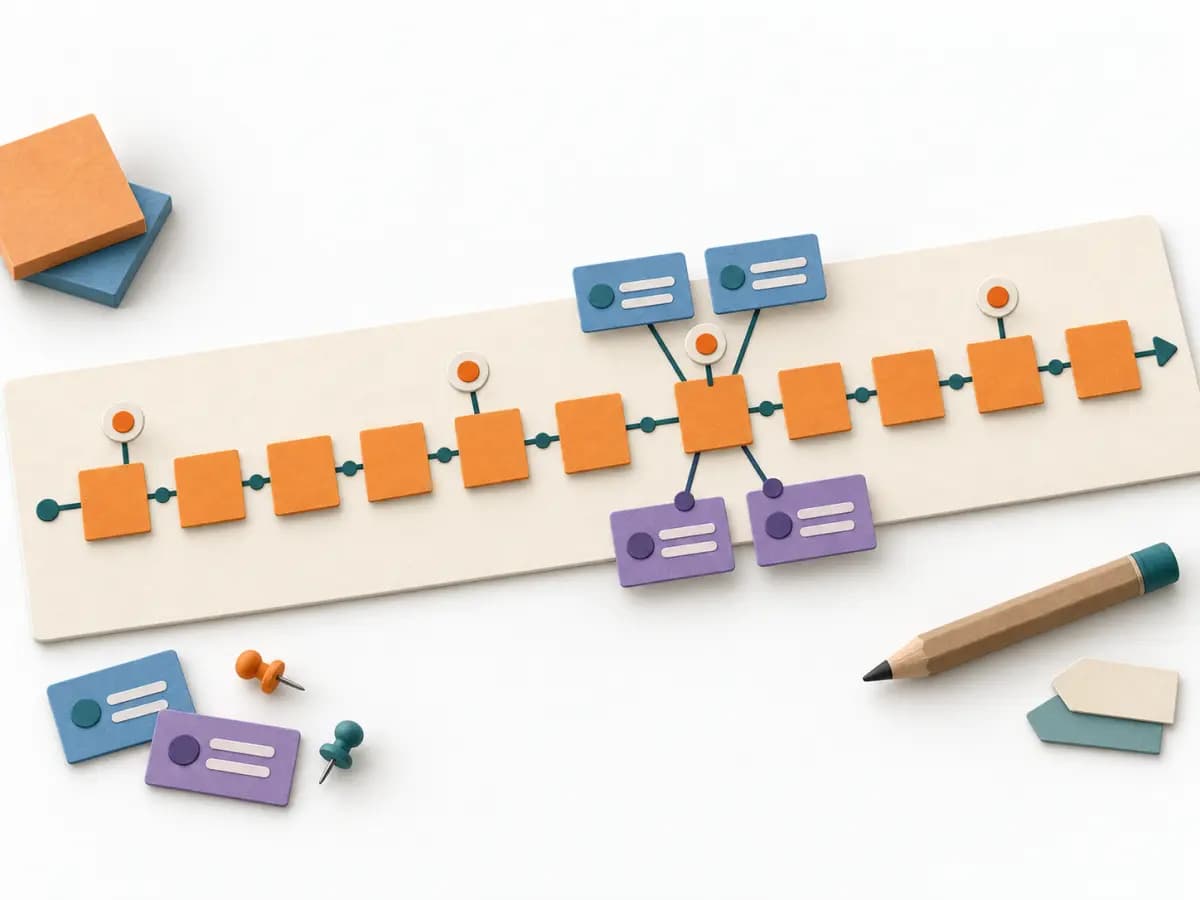
Purposedifferent | When experiences build up over days or weeks and a single session cannot capture them, Diary Study records the course of everyday life. Recurring triggers, moods, and habits become visible this way, beyond the sharpness of memory. | Event Modeling connects business workflows with commands, events, and views into one coherent mental model. It helps design behavior, UI, and technical slices from the same underlying logic. | For a process, product, or service with noticeable failure risks, the method assesses possible failure modes in advance. It directs attention to combinations of occurrence, effect, and detectability. |
Complexitydifferent | Medium | Medium | High |
Timedifferent | 1-4 Wochen | 2-6 h | 2-6 h |
Participantsdifferent | 5-20 | 2-8 | 3-10 |
Formatdifferent | Async | Workshop + async | Workshop |
Outputdifferent | Diary Entries, Longitudinal Patterns, Experience Timeline | Event Model, UI Flow, Commands, Read Models | FMEA Table, Risk Priority, Mitigation Actions |
Tagsno overlap | UX researchTrackingBehavior | EventsBlueprintDomain-Driven DesignBehavior | RiskQualityOperationsRoot cause |
Often compared together
Methods with strong topical overlap with the current selection, not yet in the comparison.