View methods side by side.
Choose up to four methods. Add them using the search and share the comparison by copying its link.
| Criterion |  Decision Making Decision Tree | 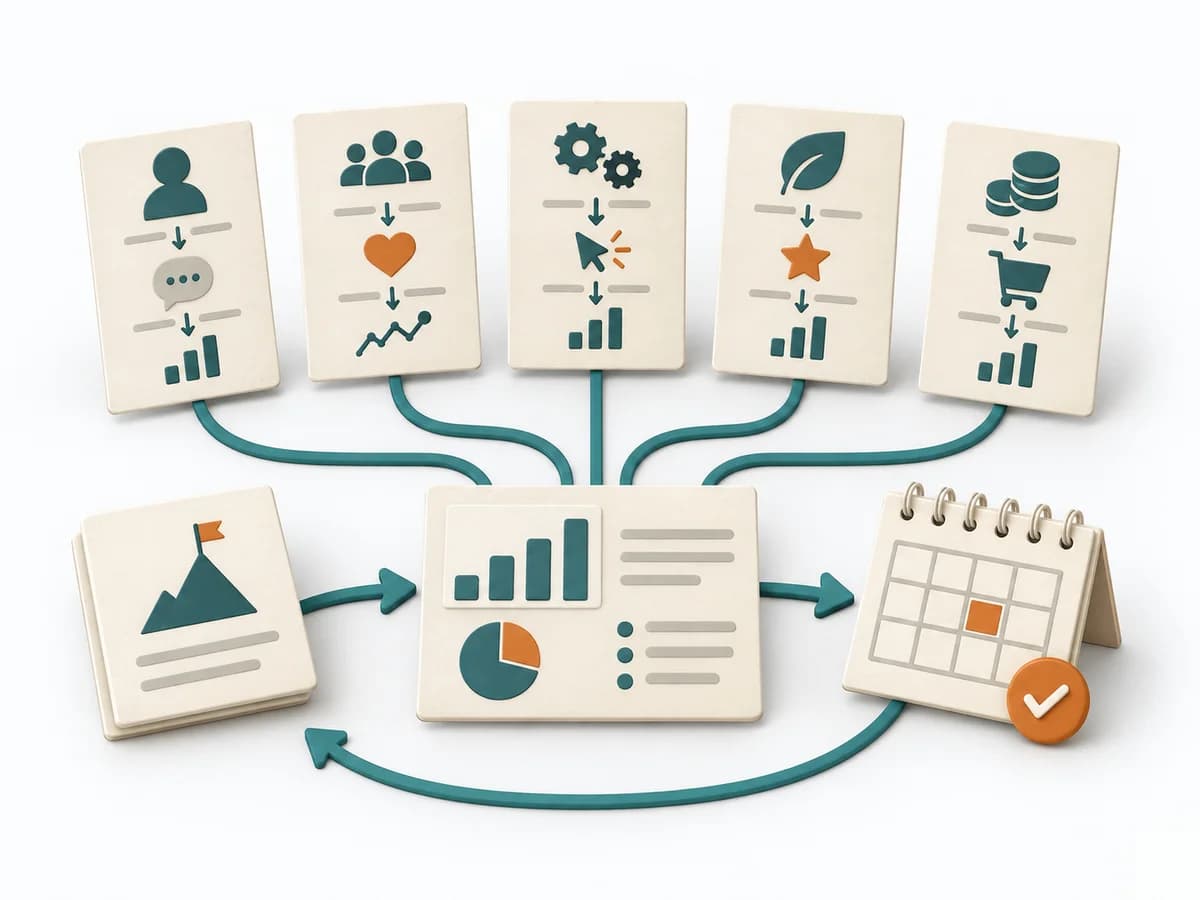 UX Research HEART Framework |  Engineering Goal Question Metric |
|---|---|---|---|
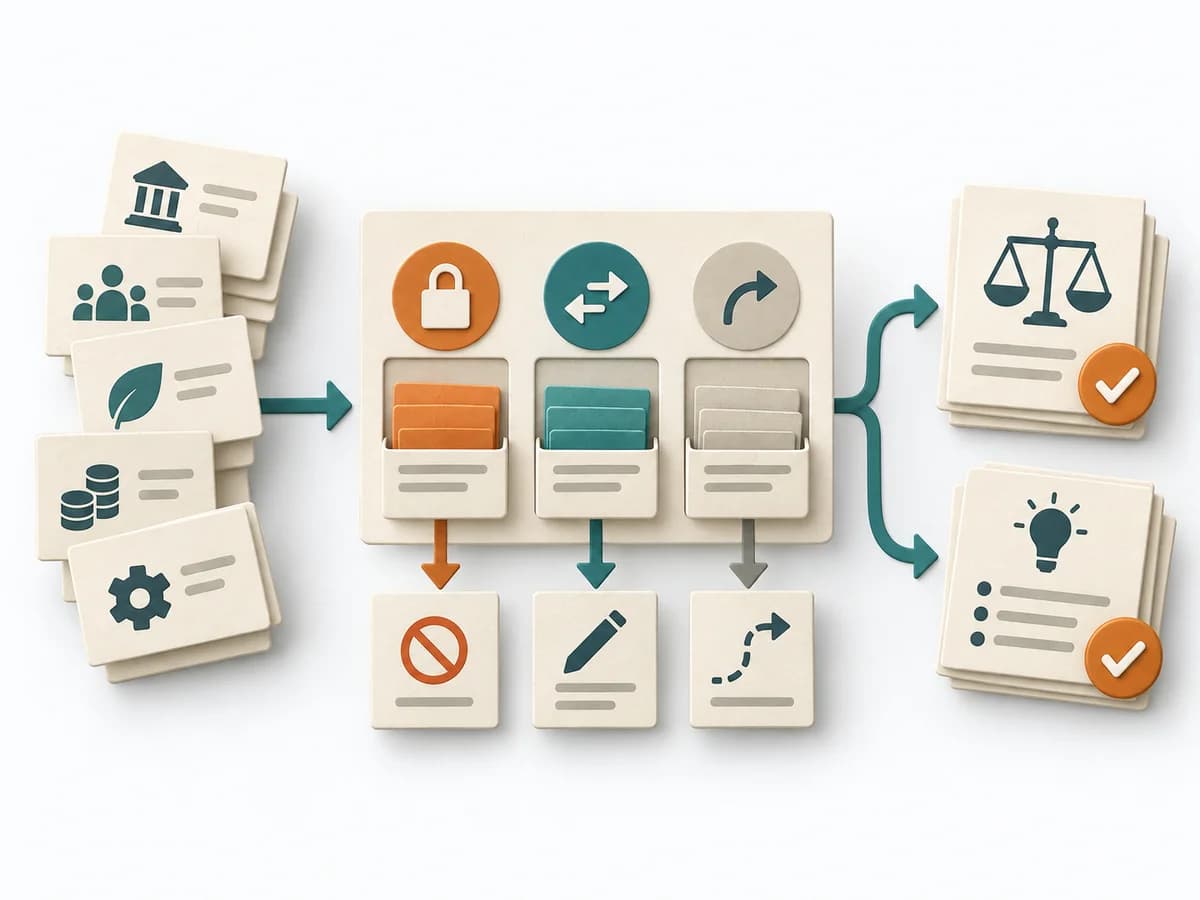
Purposedifferent | For decisions with follow-on paths and dependencies, a linear comparison is often not enough. A Decision Tree shows how options branch under conditions and which consequences hang on each branch. | Helps clarify observations, needs, and patterns in concrete terms. It groups observations into patterns, questions, and decisions. The result is captured as a HEART-GSM table and dashboard. | Helps clarify technical problems, hypotheses, and next steps in concrete terms. It breaks a technical problem into testable parts. The result is captured as a GQM table and metric briefs. |
Complexitysame | Medium | Medium | Medium |
Timedifferent | 30-90 min | 120 min initial, dann laufend | 90-180 min |
Participantsdifferent | 1-6 | 3-6 | 3-6 |
Formatdifferent | Workshop + async | Workshop + async | Workshop |
Outputdifferent | Decision Tree, Option Map, Assumption List | HEART-GSM Table, Dashboard | GQM Table, Metric Profiles |
Tagsno overlap | DecisionTreeOptions | MetricsUX researchMeasurementSatisfaction | MetricsMeasurementEngineeringAlignment |
Often compared together
Methods with strong topical overlap with the current selection, not yet in the comparison.