View methods side by side.
Choose up to four methods. Add them using the search and share the comparison by copying its link.
| Criterion |  Decision Making Decision Rights Mapping |  Growth Flywheel | 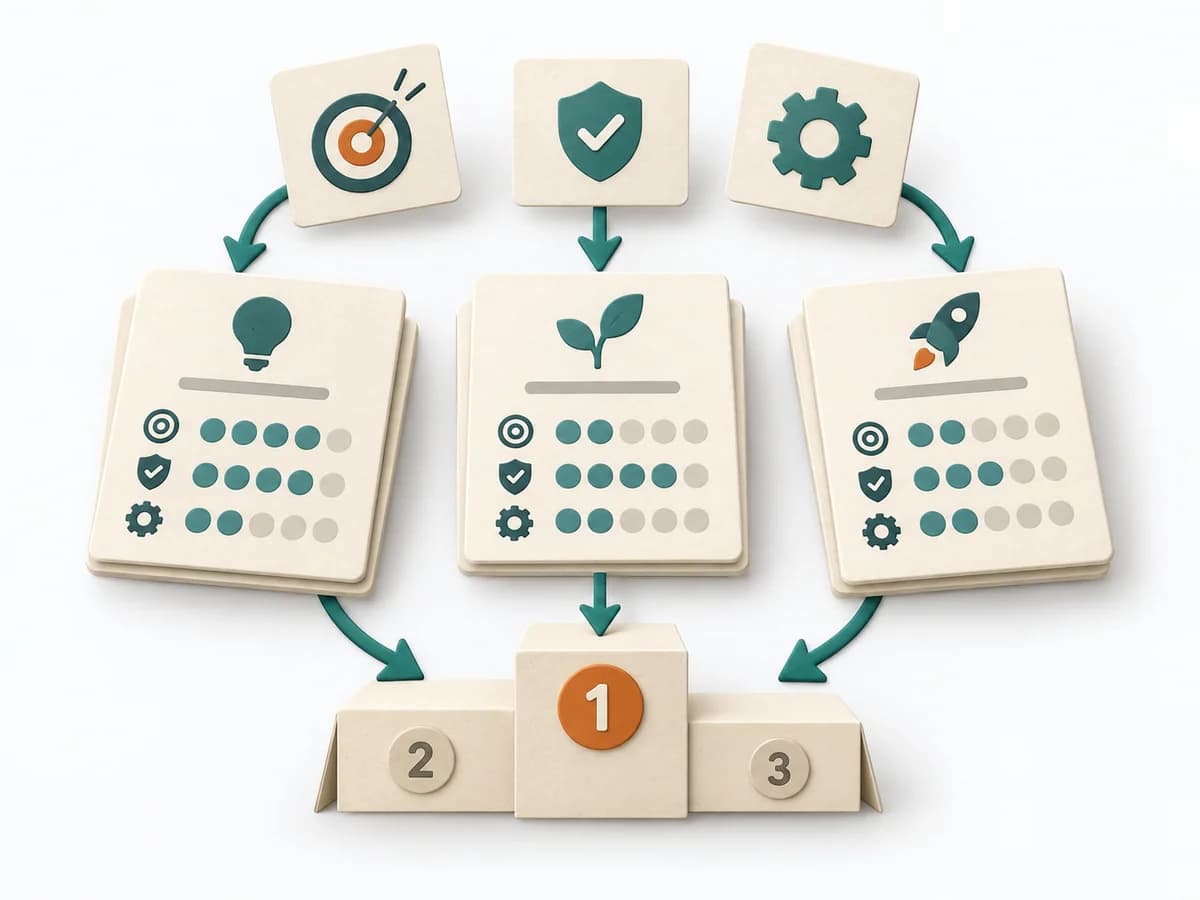 Product Strategy ICE Scoring |
|---|---|---|---|
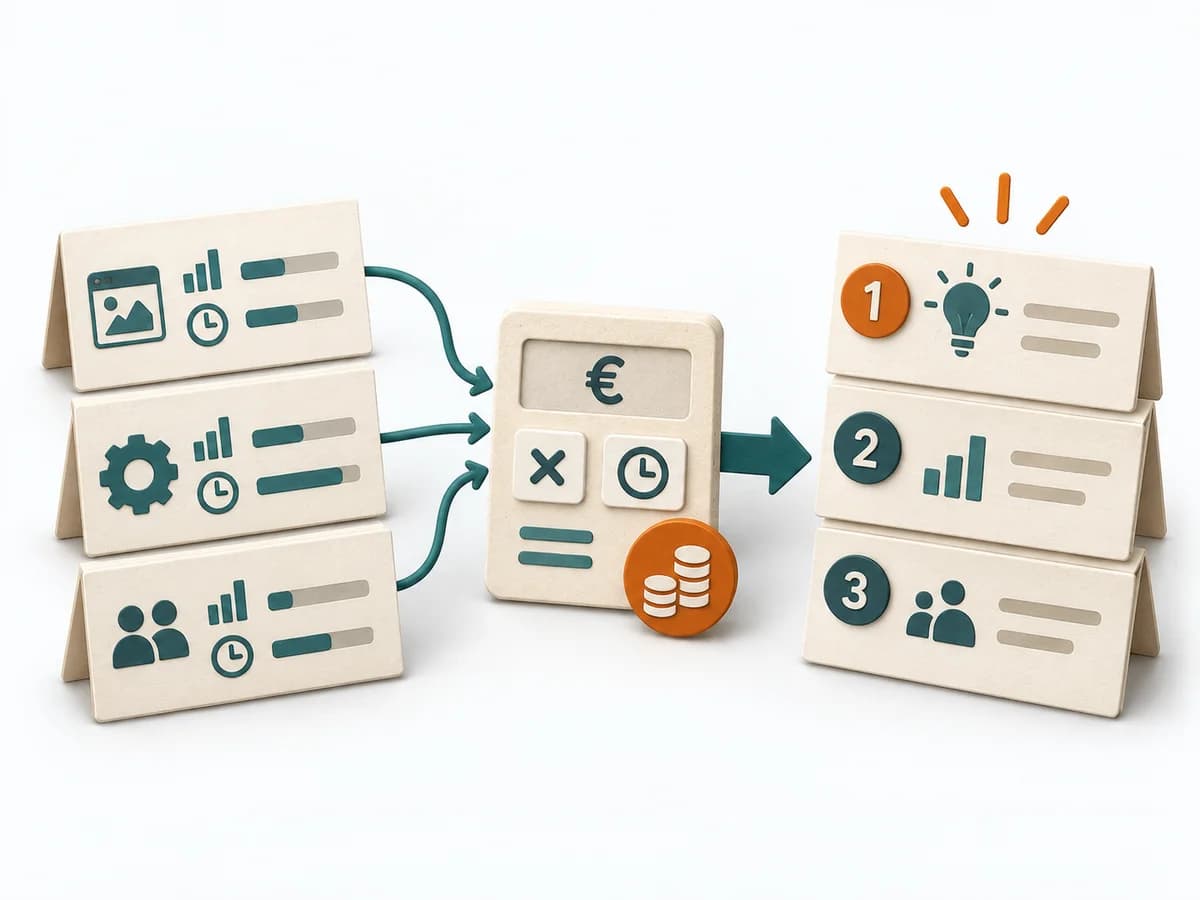
Purposedifferent | In organizations with many stakeholders, it often blurs who actually decides and who is merely consulted. It separates options, evaluation criteria, and open risks. The result is captured as a Decision Rights matrix and an agreement. | Growth often breaks down where a reinforcing mechanism builds up too much friction. A Flywheel shows the cycle of value, repetition, and reinforcement meant to sustain growth. | When ideas need sorting quickly, it condenses impact, confidence, and effort into one compact score. It connects customer value, product logic, and decision priorities. The result is captured as an ICE table and top-ideas list. |
Complexitydifferent | Medium | Medium | Low |
Timedifferent | 90-180 min | 60-120 min | 30-60 min |
Participantsdifferent | 4-12 | 3-8 | 2-8 |
Formatdifferent | Workshop | Workshop | Workshop + async |
Outputdifferent | Decision Rights Matrix, Agreement | Flywheel Map, Friction Points, Growth Levers, Experiment Backlog | ICE Table, Top Idea List |
Tagsno overlap | DecisionGovernanceAlignmentResponsibility | GrowthRetentionConversion | PrioritizationScoringGrowthDecision |
Often compared together
Methods with strong topical overlap with the current selection, not yet in the comparison.