View methods side by side.
Choose up to four methods. Add them using the search and share the comparison by copying its link.
| Criterion |  Decision Making Decision Matrix |  Knowledge Modeling Event Modeling |
|---|---|---|
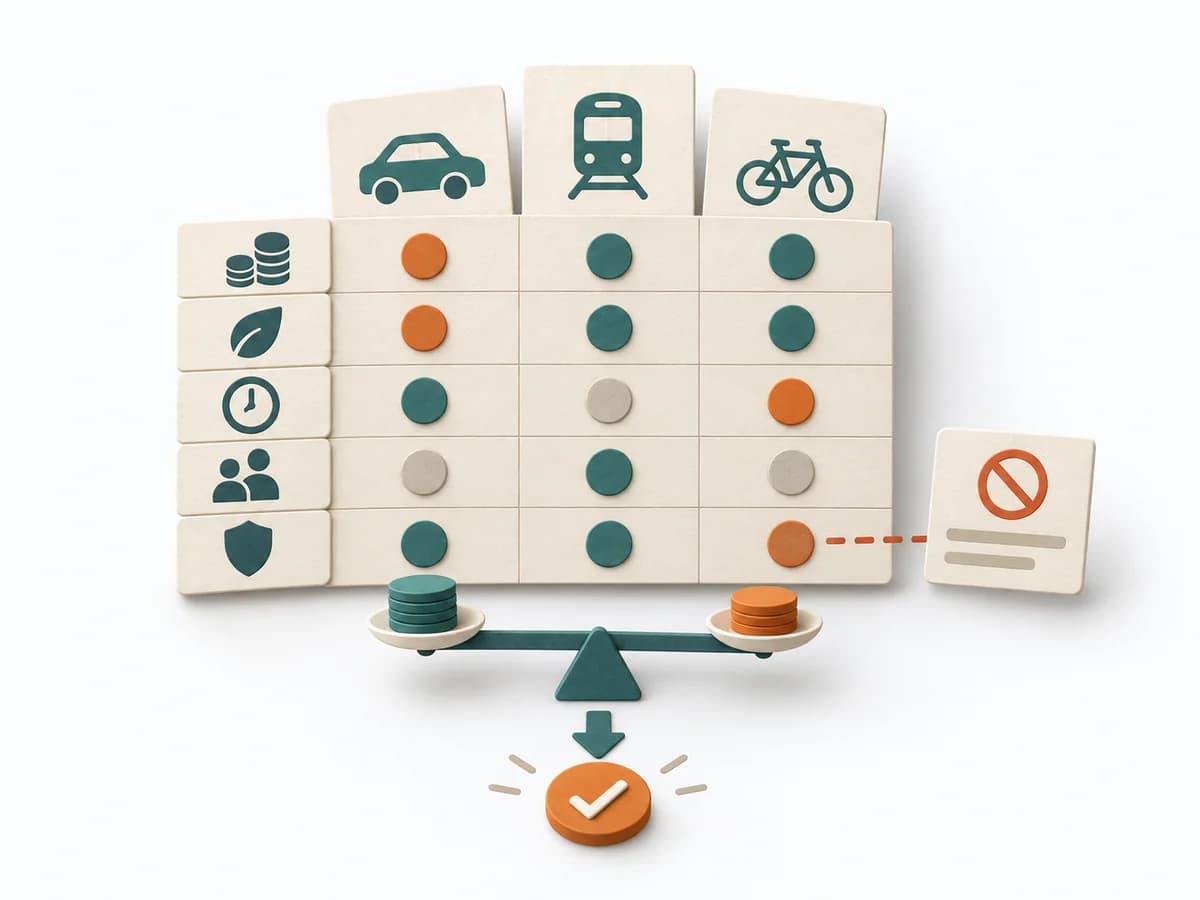
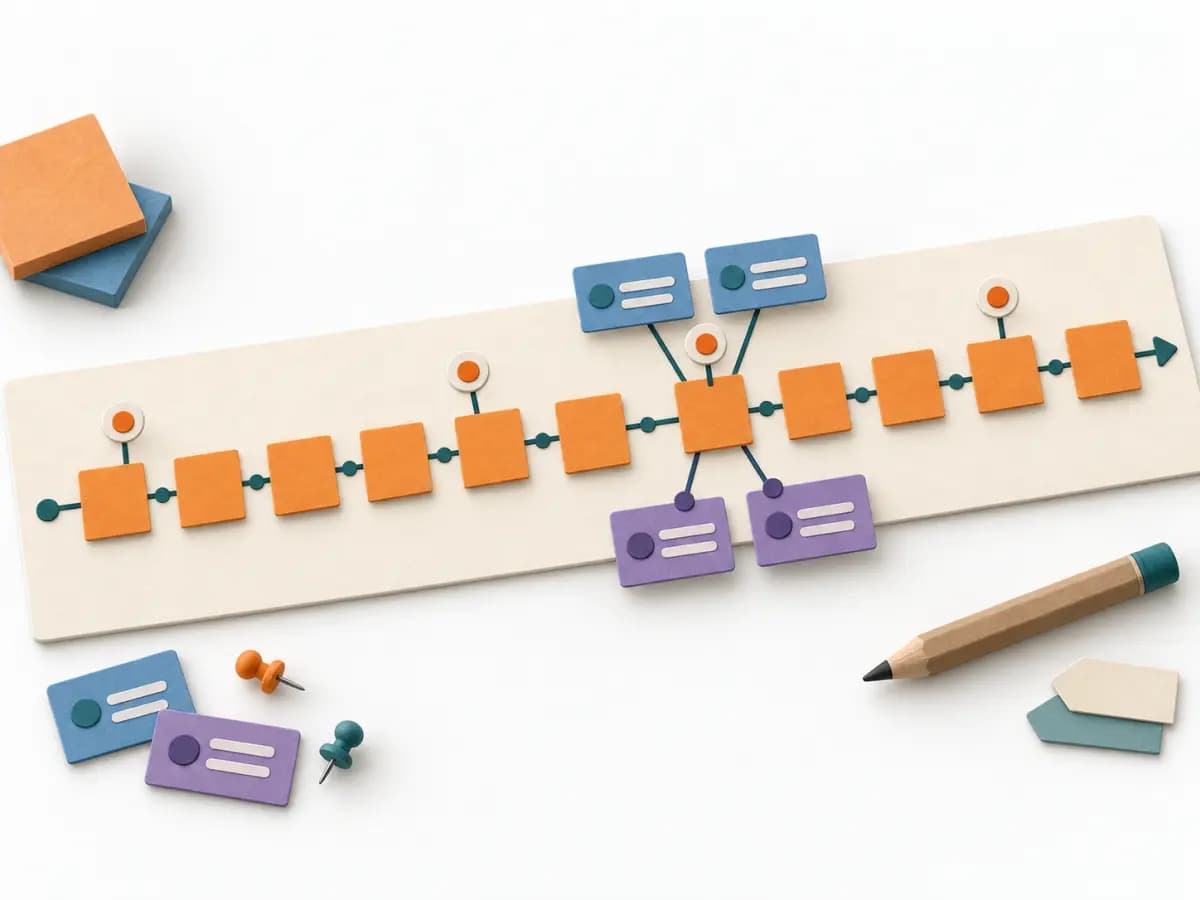
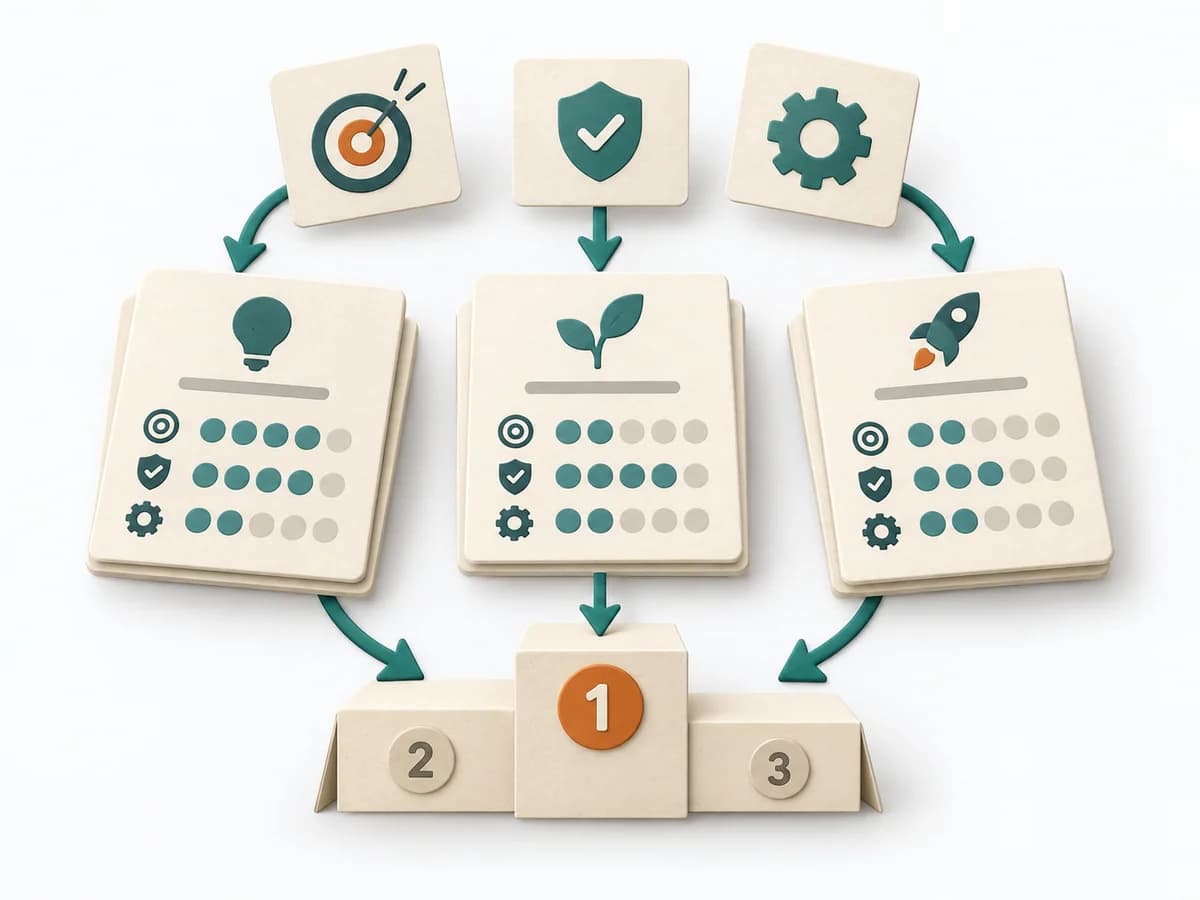
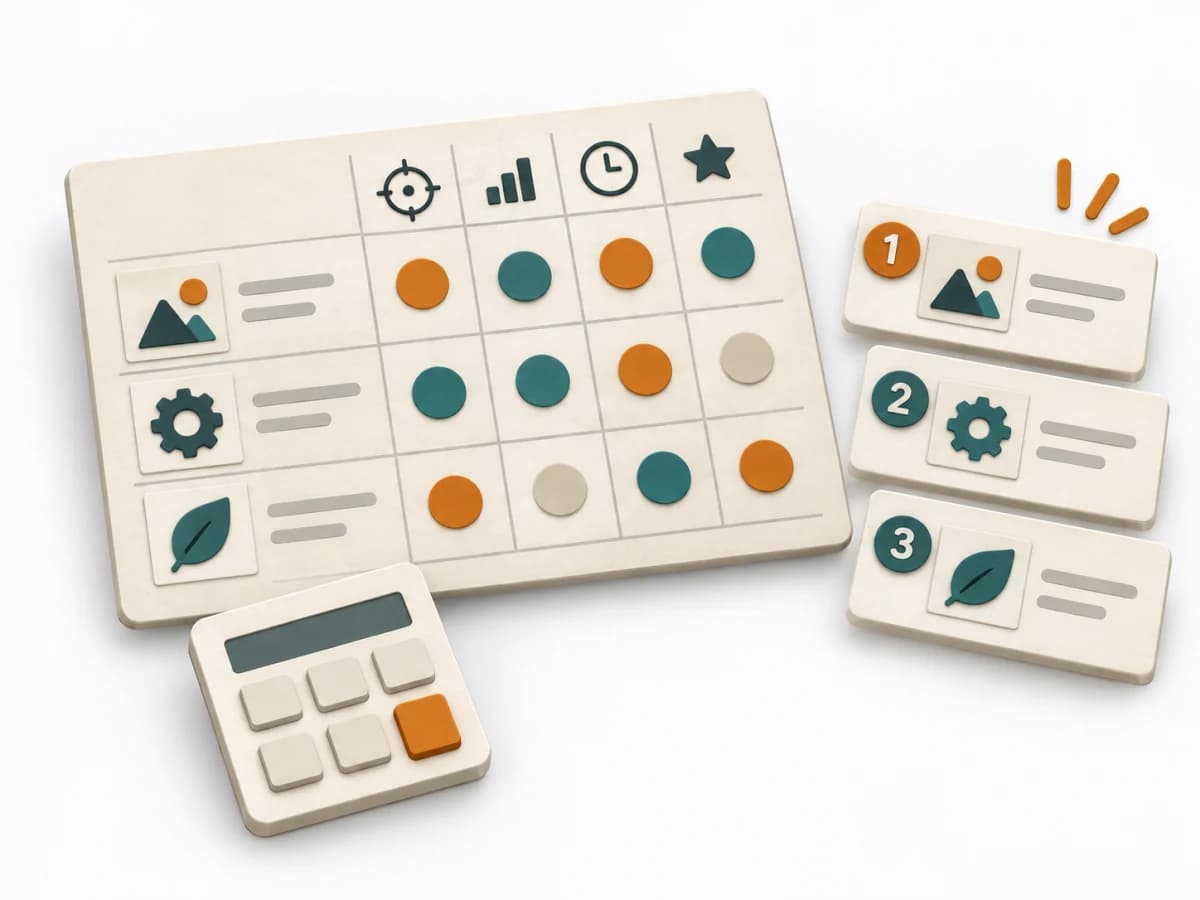
Purposedifferent | When several options collide with several criteria, comparison quickly becomes subjective. A Decision Matrix makes the trade-off visible and brings weighting, criteria, and options into a shared logic. | Event Modeling connects business workflows with commands, events, and views into one coherent mental model. It helps design behavior, UI, and technical slices from the same underlying logic. |
Complexitysame | Medium | Medium |
Timedifferent | 45-90 min | 2-6 h |
Participantssame | 2-8 | 2-8 |
Formatsame | Workshop + async | Workshop + async |
Outputdifferent | Decision Matrix, Scoring Rationale, Selected Option | Event Model, UI Flow, Commands, Read Models |
Tagsno overlap | DecisionCriteriaScoringTradeoffs | EventsBlueprintDomain-Driven DesignBehavior |
Often compared together
Methods with strong topical overlap with the current selection, not yet in the comparison.