View methods side by side.
Choose up to four methods. Add them using the search and share the comparison by copying its link.
| Criterion | 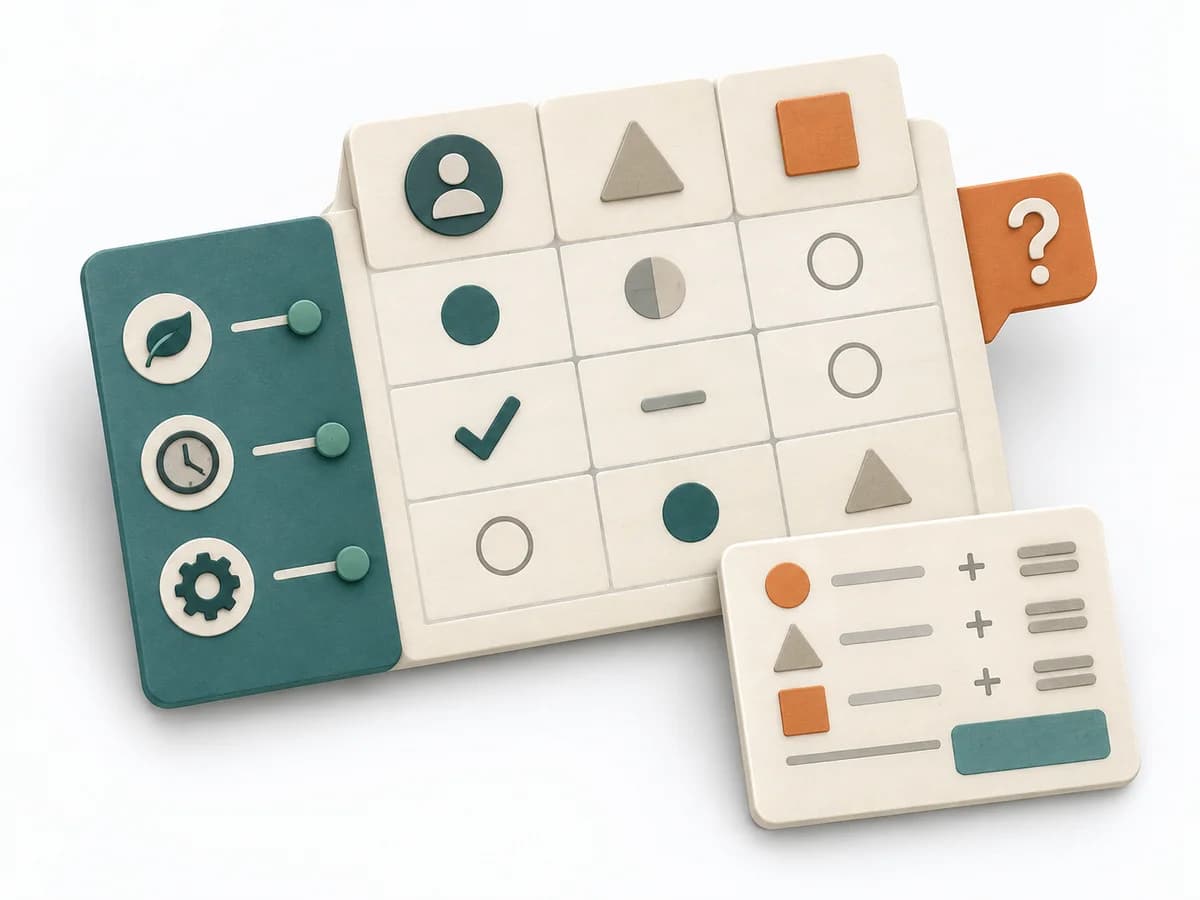 Decision Making Decision Matrix |  Systems Thinking Behavior Over Time Graph |  Product Strategy ICE Scoring |
|---|---|---|---|
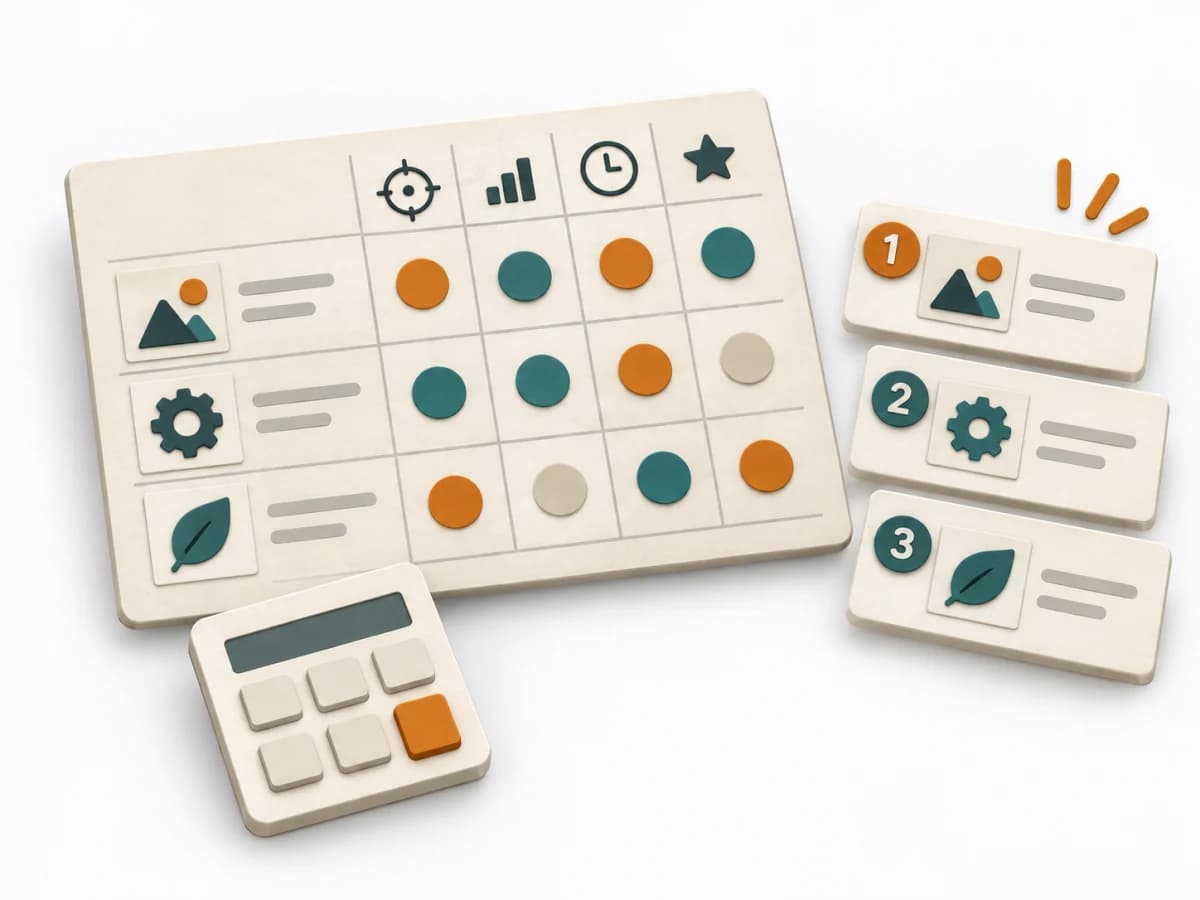
Purposedifferent | When several options collide with several criteria, comparison quickly becomes subjective. A Decision Matrix makes the trade-off visible and brings weighting, criteria, and options into a shared logic. | A Behavior Over Time Graph shows how a metric or observation develops over time. The method makes trends, breaks, and recurring patterns visible that get lost in snapshots. | When ideas need sorting quickly, it condenses impact, confidence, and effort into one compact score. It connects customer value, product logic, and decision priorities. The result is captured as an ICE table and top-ideas list. |
Complexitydifferent | Medium | Low | Low |
Timedifferent | 45-90 min | 20-45 min | 30-60 min |
Participantsdifferent | 2-8 | 1-10 | 2-8 |
Formatsame | Workshop + async | Workshop + async | Workshop + async |
Outputdifferent | Decision Matrix, Scoring Rationale, Selected Option | Behavior Over Time Graph, Trend Hypotheses, Key Events | ICE Table, Top Idea List |
Tagsno overlap | DecisionCriteriaScoringTradeoffs | Systems thinkingPatternsDynamics | PrioritizationScoringGrowthDecision |
Often compared together
Methods with strong topical overlap with the current selection, not yet in the comparison.