View methods side by side.
Choose up to four methods. Add them using the search and share the comparison by copying its link.
| Criterion |  Operations Change Analysis |  Systems Thinking System Dynamics Simulation |  Systems Thinking Current Reality Tree |
|---|---|---|---|
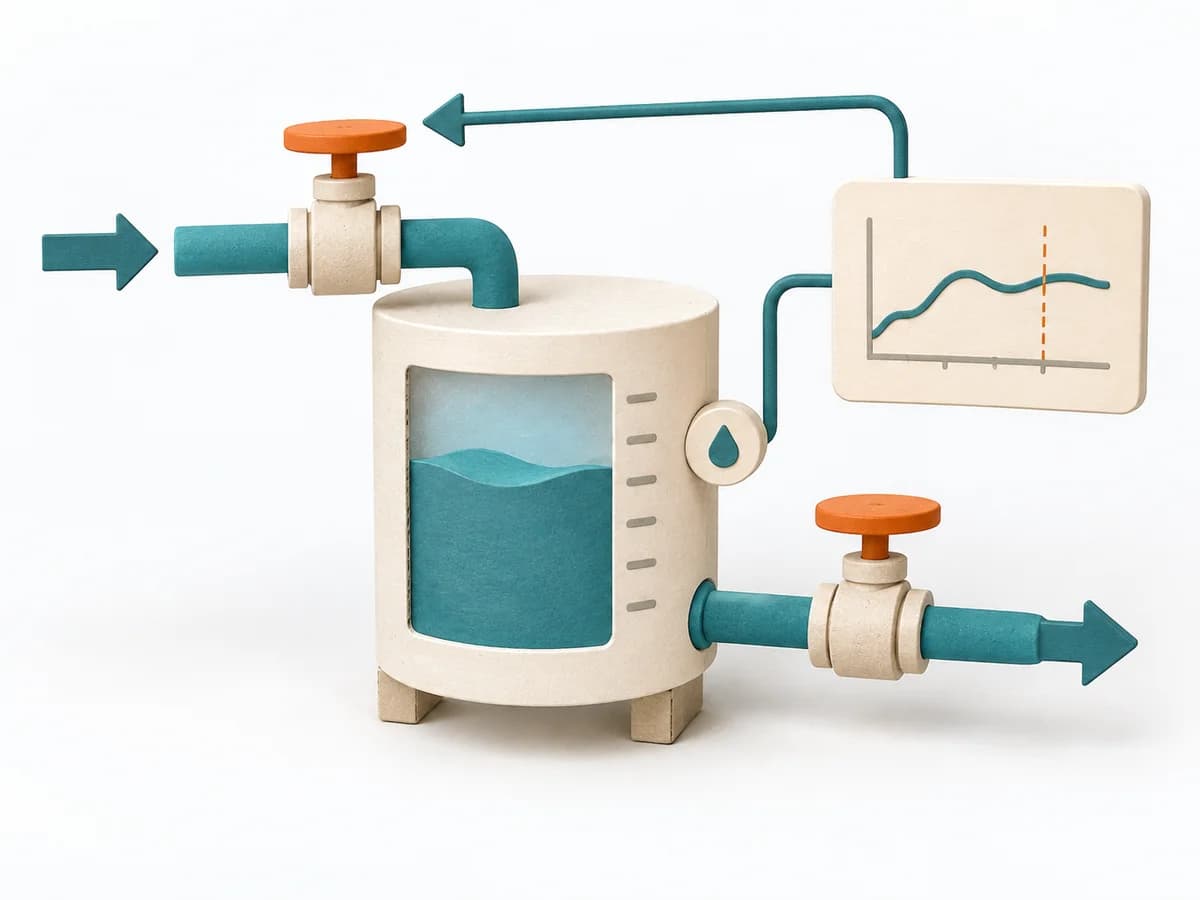
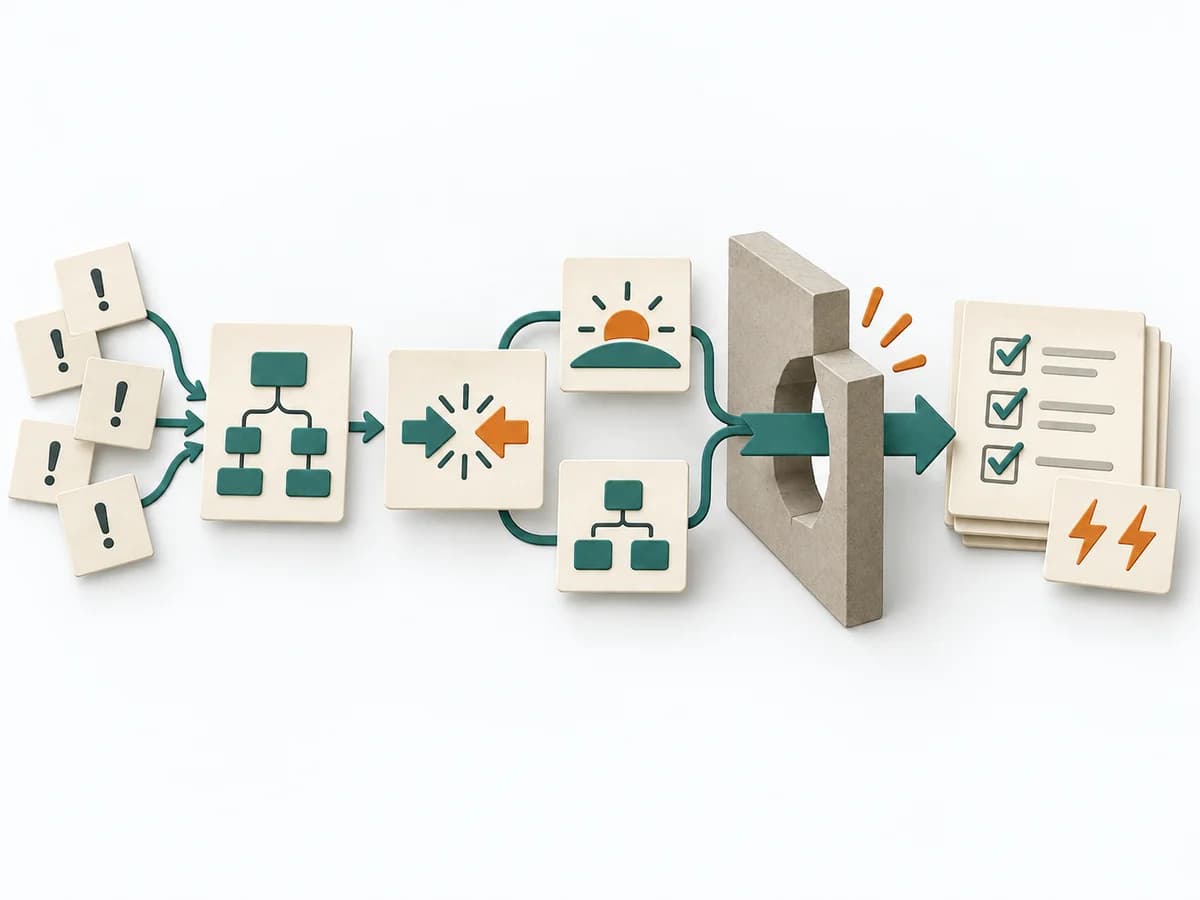
Purposedifferent | For a deviation after a change, the method isolates the influence of the altered condition. It narrows down which differences are relevant and which are just accompanying noise. | System Dynamics Simulation makes assumptions about time, delay, and feedback testable through experiments. It draws relationships, patterns, and feedback loops. The result is captured as a simulation model and scenario reports. | A Current Reality Tree condenses many symptoms into a few causal chains. The method makes visible which core problems drive several negative effects at once. |
Complexitydifferent | Medium | High | High |
Timedifferent | 45-120 min | Mehrere Tage bis Wochen | 2-6 h |
Participantsdifferent | 2-6 | 1-5 Modellierende, Stakeholder asynchron | 3-8 |
Formatdifferent | Workshop + async | Async | Workshop |
Outputdifferent | Change Matrix, Cause Hypotheses, Validation Questions, Action List | Simulation Model, Scenario Reports | Current Reality Tree, Core Problems, Intervention Ideas |
Tagsno overlap | ChangeRoot causeTroubleshootingComparison | Systems thinkingDynamicsSimulationAnalysis | Systems thinkingRoot causeConstraintsCausality |
Often compared together
Methods with strong topical overlap with the current selection, not yet in the comparison.