View methods side by side.
Choose up to four methods. Add them using the search and share the comparison by copying its link.
| Criterion | 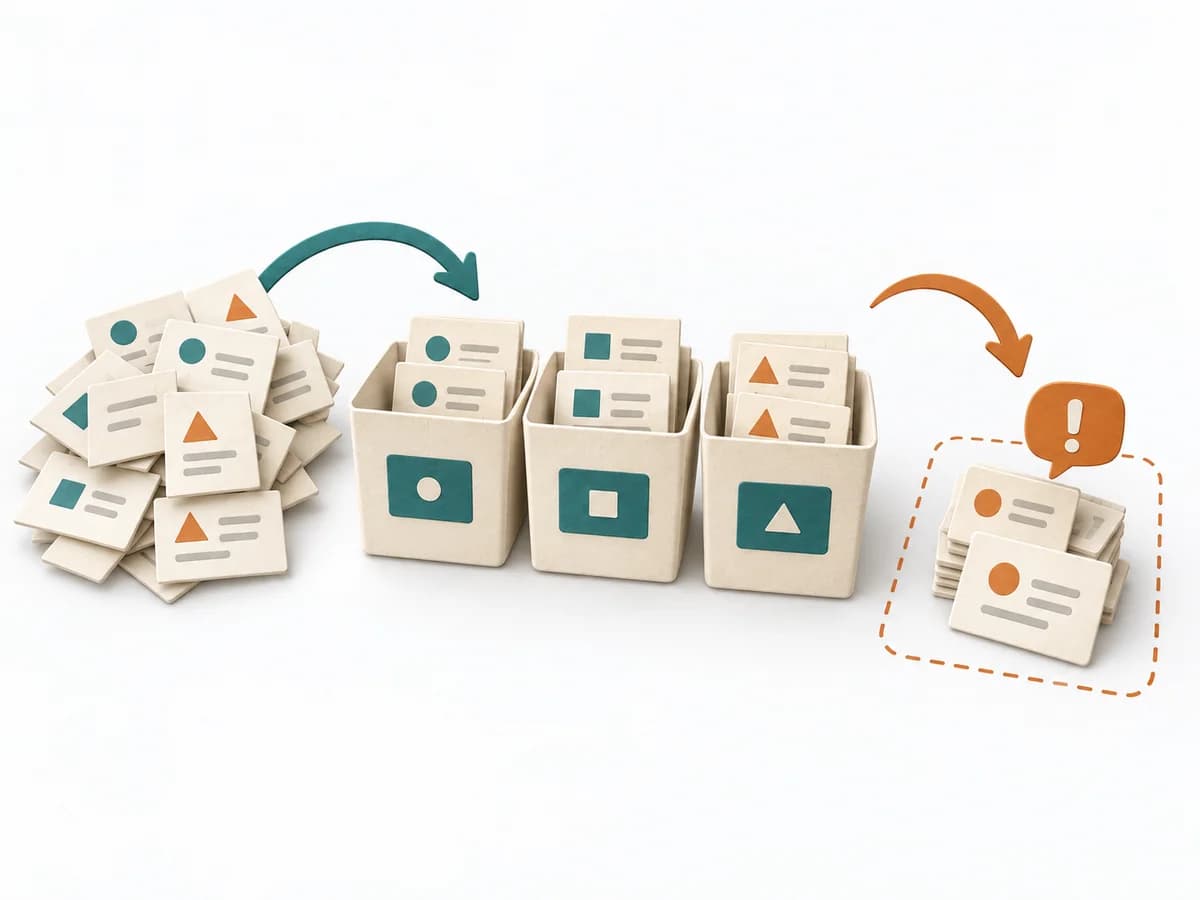 Agile Bucket System |  Operations Fishbone Diagram | 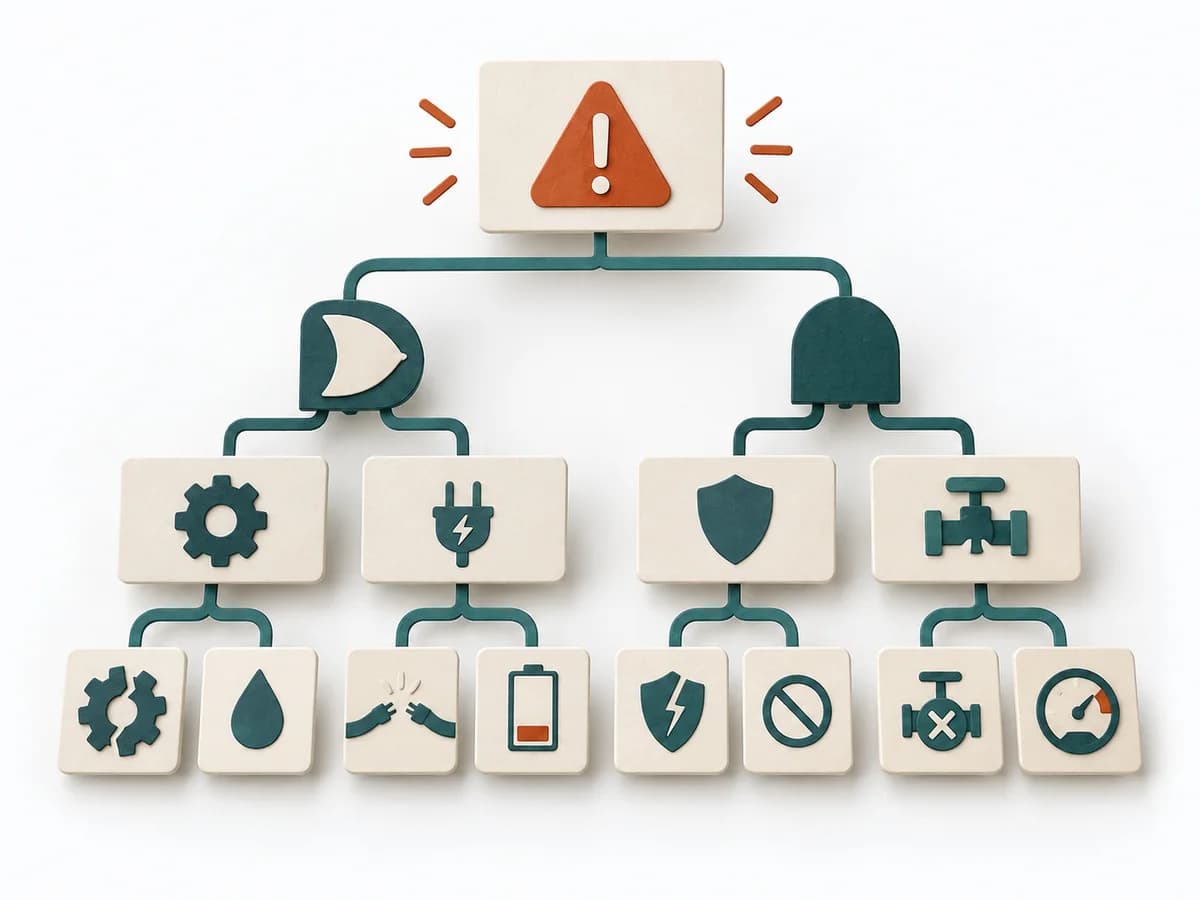 Operations Fault Tree Analysis |
|---|---|---|---|
Purposedifferent | When a large batch of work needs a fast, rough estimate, it sorts items into predefined size buckets. It sorts work by value, risk, and delivery ability. The result is captured as a Bucketed Backlog, Relative Estimates, and Split Candidates. | When a problem has several possible contributing factors, the method sorts causes by cause areas. It prevents an initial hunch from blocking the view of other plausible drivers. | For a critical top event with several possible triggers, the method logically models failure paths. It makes visible which combinations of conditions can lead to damage. |
Complexitydifferent | Medium | Low | High |
Timedifferent | 30-90 min | 30-60 min | 2-6 h |
Participantsdifferent | 3-12 | 2-8 | 3-8 |
Formatdifferent | Workshop | Workshop | Workshop + async |
Outputdifferent | Bucketed Backlog, Relative Estimates, Split Candidates | Fishbone Diagram, Cause Categories, Investigation Backlog | Fault Tree, Critical Paths, Cause Hypotheses, Control Actions |
Tagsno overlap | EstimationBacklogRelative sizing | Root causeQualityOperations | RiskRoot causeSafety |
Often compared together
Methods with strong topical overlap with the current selection, not yet in the comparison.