View methods side by side.
Choose up to four methods. Add them using the search and share the comparison by copying its link.
| Criterion |  Operations Barrier Analysis |  Operations 5 Whys |  Systems Thinking Stock and Flow Diagram |
|---|---|---|---|
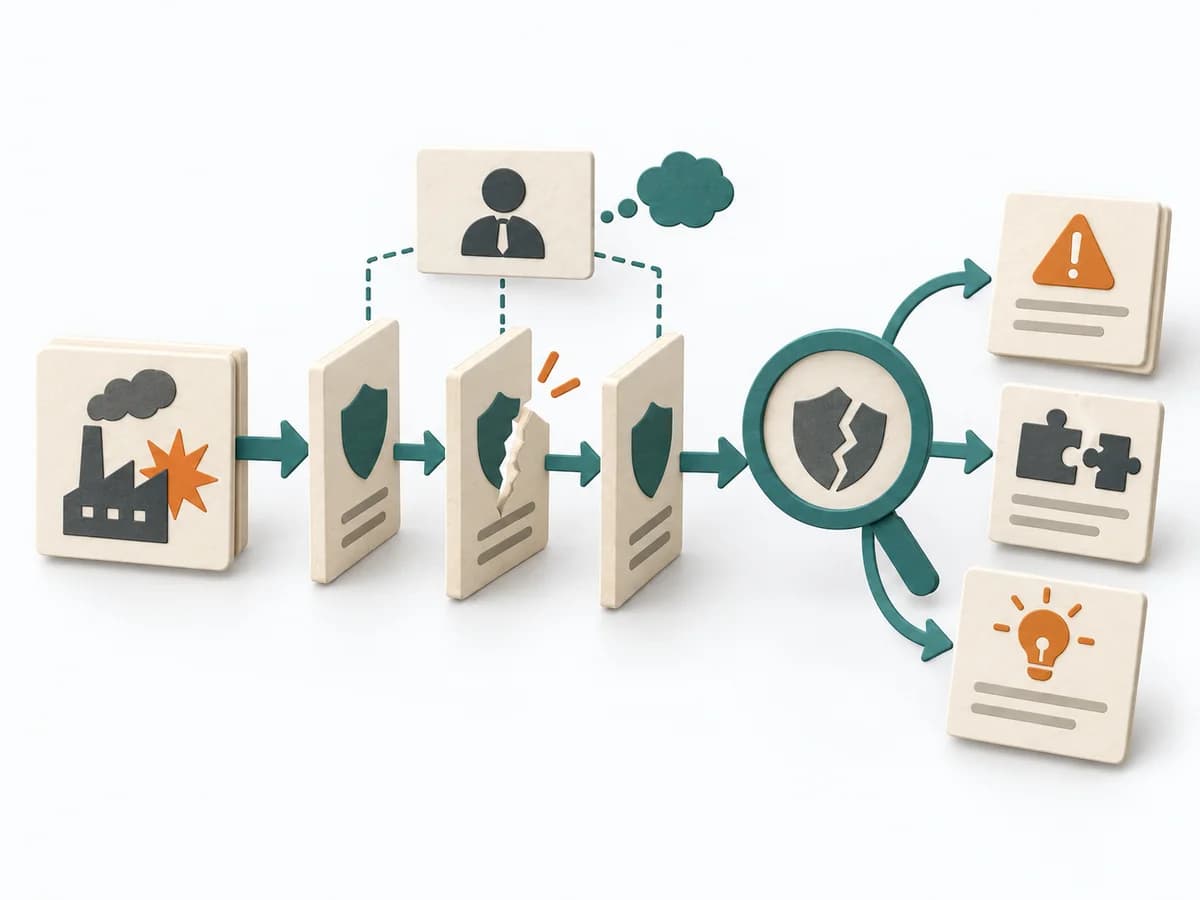
Purposedifferent | For a risk that can only be managed through multiple layers of protection, the method examines the effectiveness of each barrier. It shows where safeguards are missing, too weak, or fail under real conditions. | For a single, hard-to-explain deviation, the method exposes the causal chain behind the visible symptom. It keeps the cause open until a controllable condition emerges instead of a mere description. | A Stock and Flow Diagram shows how stocks, inflows, and outflows shape a system over time. It is especially suited when growth, delays, or capacity limits determine the dynamics. |
Complexitydifferent | Medium | Low | High |
Timedifferent | 2-4 h | 15-30 min | 2-6 h |
Participantsdifferent | 2-6 | 2-6 | 1-6 |
Formatdifferent | Workshop + async | Workshop | Workshop + async |
Outputdifferent | Barrier Inventory, Failure Analysis per Barrier, Action Backlog | Root cause notes, Countermeasures | Stock and Flow Model, Dynamics Notes, Simulation Hypotheses |
Tagsno overlap | Root causeSafetyIncident | Root causeIncidentLeanProblem solving | DynamicsSimulationFeedbackSystems thinking |
Often compared together
Methods with strong topical overlap with the current selection, not yet in the comparison.