View methods side by side.
Choose up to four methods. Add them using the search and share the comparison by copying its link.
| Criterion |  Business Strategy Ansoff Matrix | 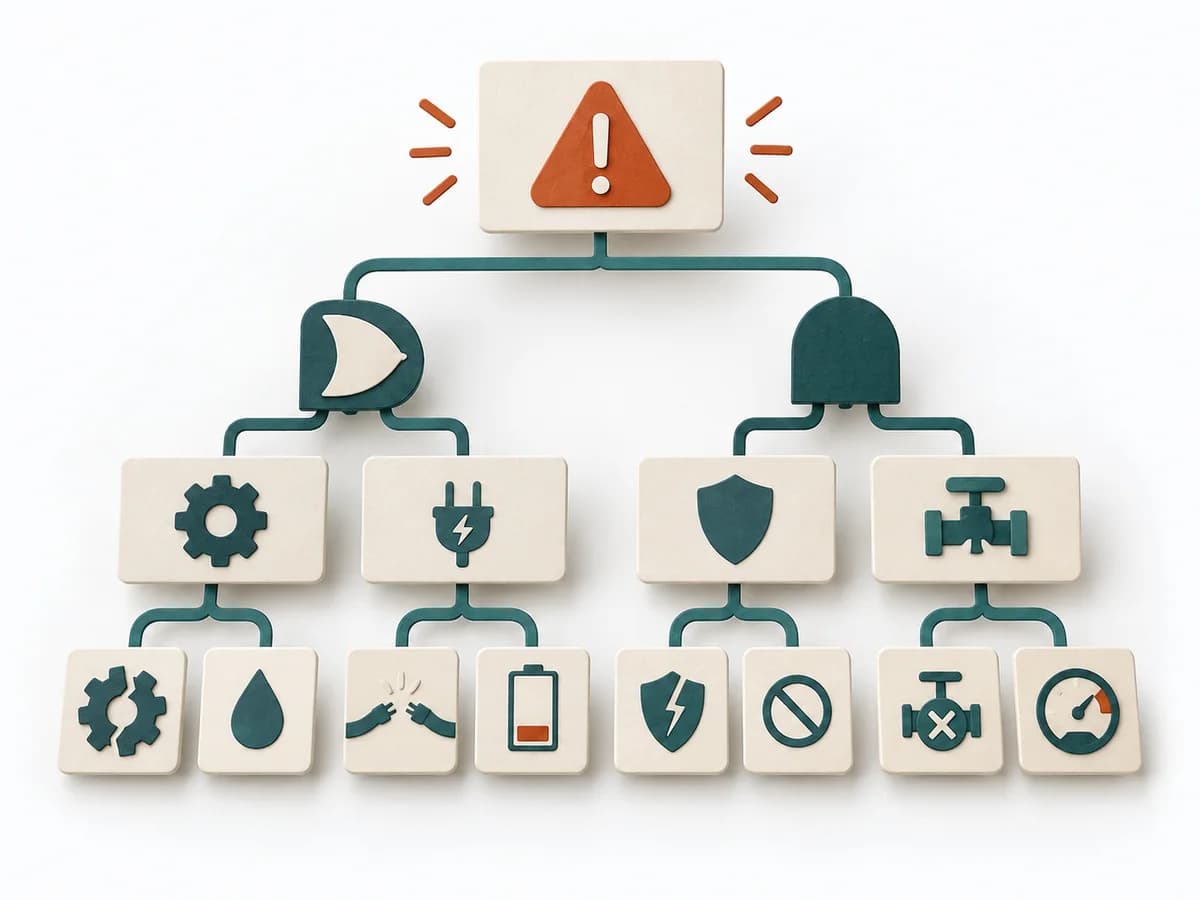 Operations Fault Tree Analysis |  Operations ABC Analysis |
|---|---|---|---|
Purposedifferent | The Ansoff Matrix organizes growth options by market and product relation. It helps weigh expansion, diversification, and adaptation cleanly against each other. | For a critical top event with several possible triggers, the method logically models failure paths. It makes visible which combinations of conditions can lead to damage. | With many similar objects of differing economic significance, the method prioritizes effort by effect. It separates what needs regular steering from what rarely needs attention. |
Complexitydifferent | Low | High | Low |
Timedifferent | 45-90 min | 2-6 h | 30-60 min |
Participantsdifferent | 2-8 | 3-8 | 1-5 |
Formatdifferent | Workshop + async | Workshop + async | Async |
Outputdifferent | Ansoff Matrix, Growth Options, Risk Notes | Fault Tree, Critical Paths, Cause Hypotheses, Control Actions | ABC Classification, Focus Rules, Control List |
Tagsno overlap | GrowthStrategyMarketPortfolio | RiskRoot causeSafety | PrioritizationOperationsPortfolio |
Often compared together
Methods with strong topical overlap with the current selection, not yet in the comparison.