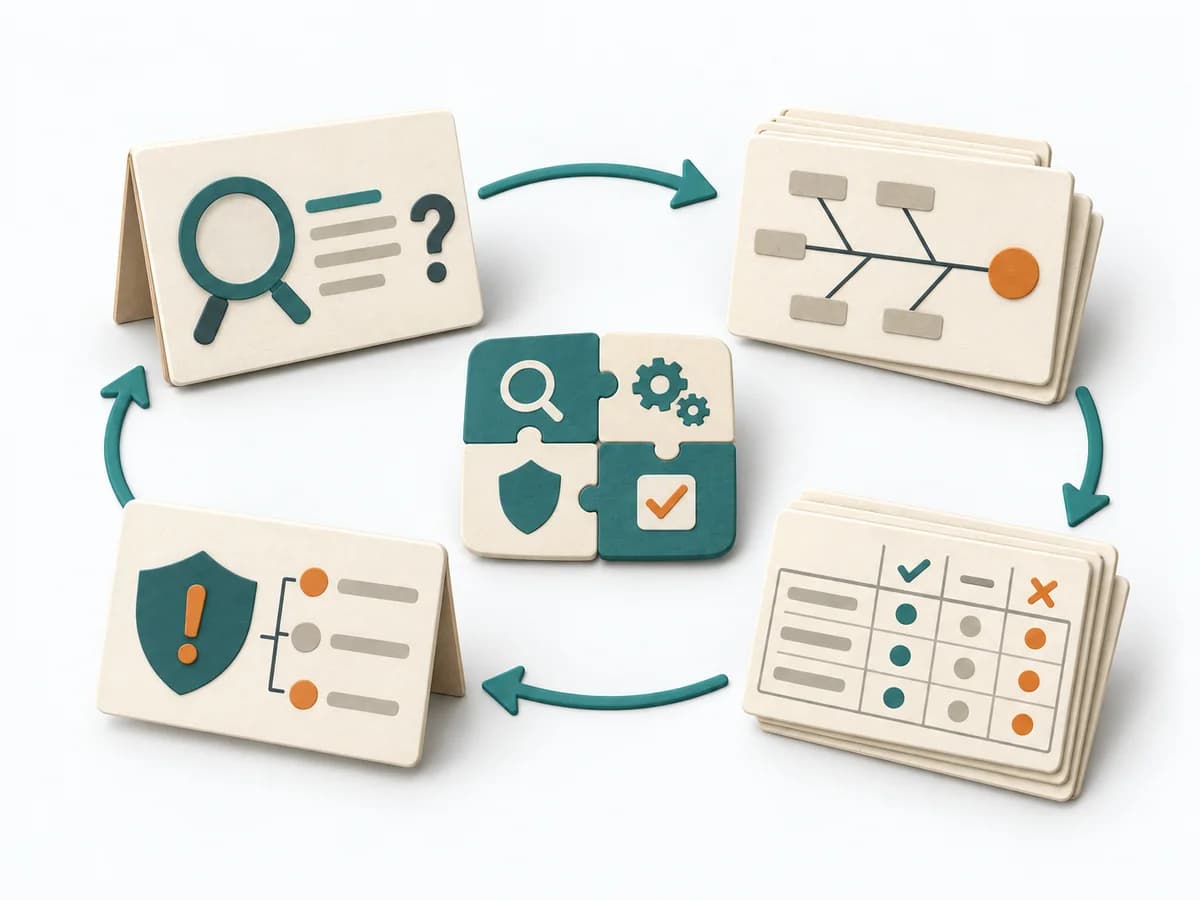
View methods side by side.
Choose up to four methods. Add them using the search and share the comparison by copying its link.
| Criterion | 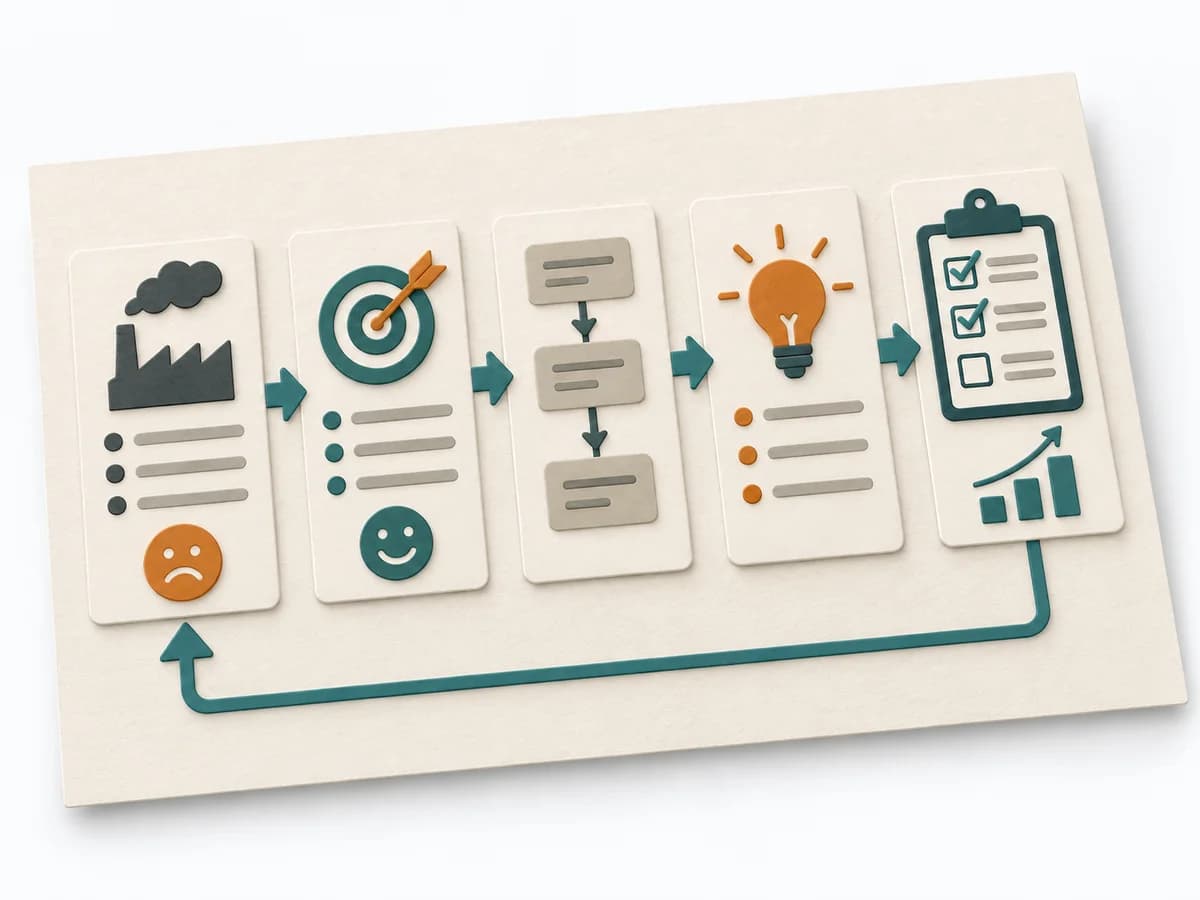 Operations A3 Problem Solving | 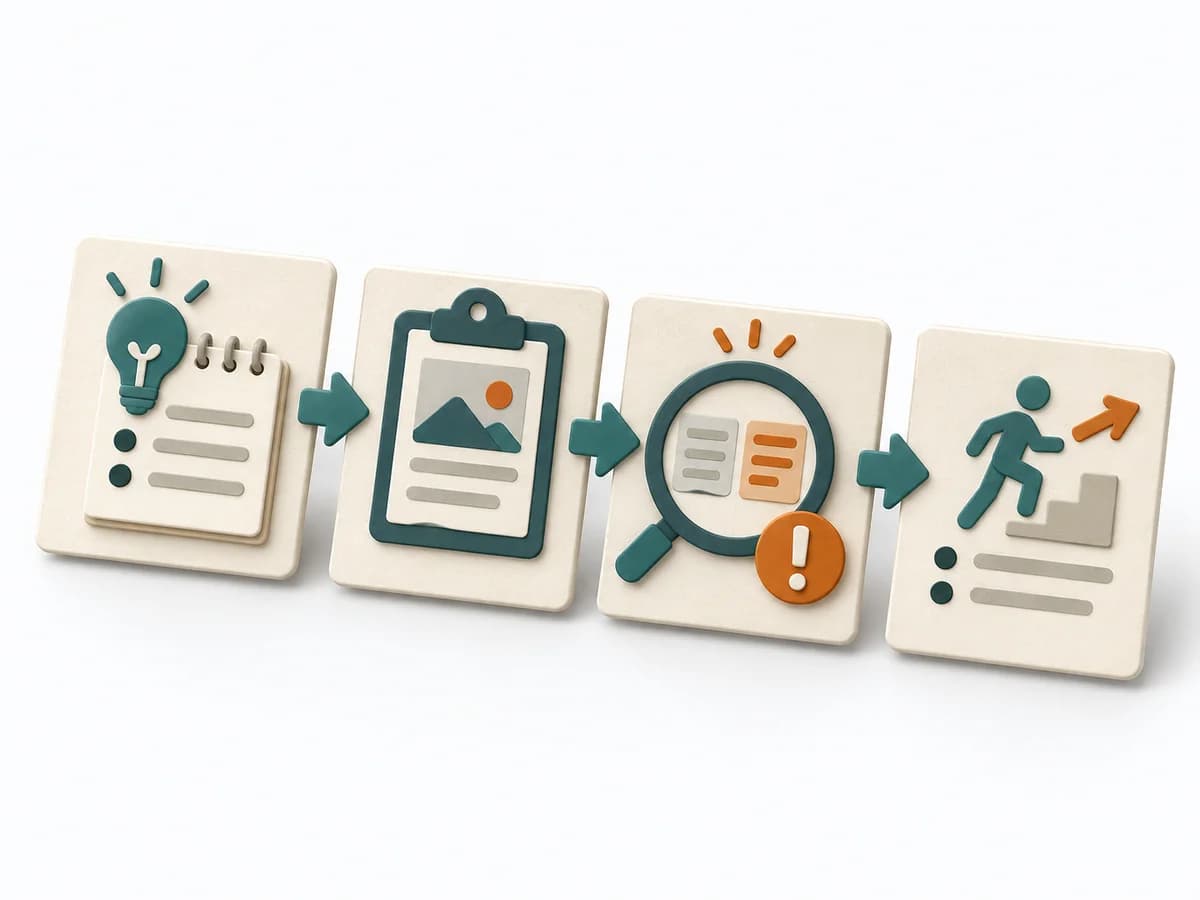 Operations After-Action Review |  Operations Failure Mode and Effects Analysis |
|---|---|---|---|
Purposedifferent | For a complex deviation with several people involved, the method bundles problem, analysis, and decision onto one page. It creates a shared working space where causes, countermeasures, and follow-up fit together. | After missions or project phases with unclear outcomes, the method makes visible what actually happened and what can be learned from it. It separates course, effect, and causes so experience turns into solid improvement. | For a process, product, or service with noticeable failure risks, the method assesses possible failure modes in advance. It directs attention to combinations of occurrence, effect, and detectability. |
Complexitydifferent | Medium | Low | High |
Timedifferent | 45-90 min | 20-45 min | 2-6 h |
Participantsdifferent | 2-5 | 3-12 | 3-10 |
Formatdifferent | Workshop + async | Workshop + async | Workshop |
Outputdifferent | A3 Report, Action Plan, Root Cause Analysis | Lessons learned, Action items, Event summary | FMEA Table, Risk Priority, Mitigation Actions |
Tags1 shared | LeanProblem solvingCoachingOperations | LearningOperationsImprovement | RiskQualityOperationsRoot cause |
Often compared together
Methods with strong topical overlap with the current selection, not yet in the comparison.