View methods side by side.
Choose up to four methods. Add them using the search and share the comparison by copying its link.
| Criterion | 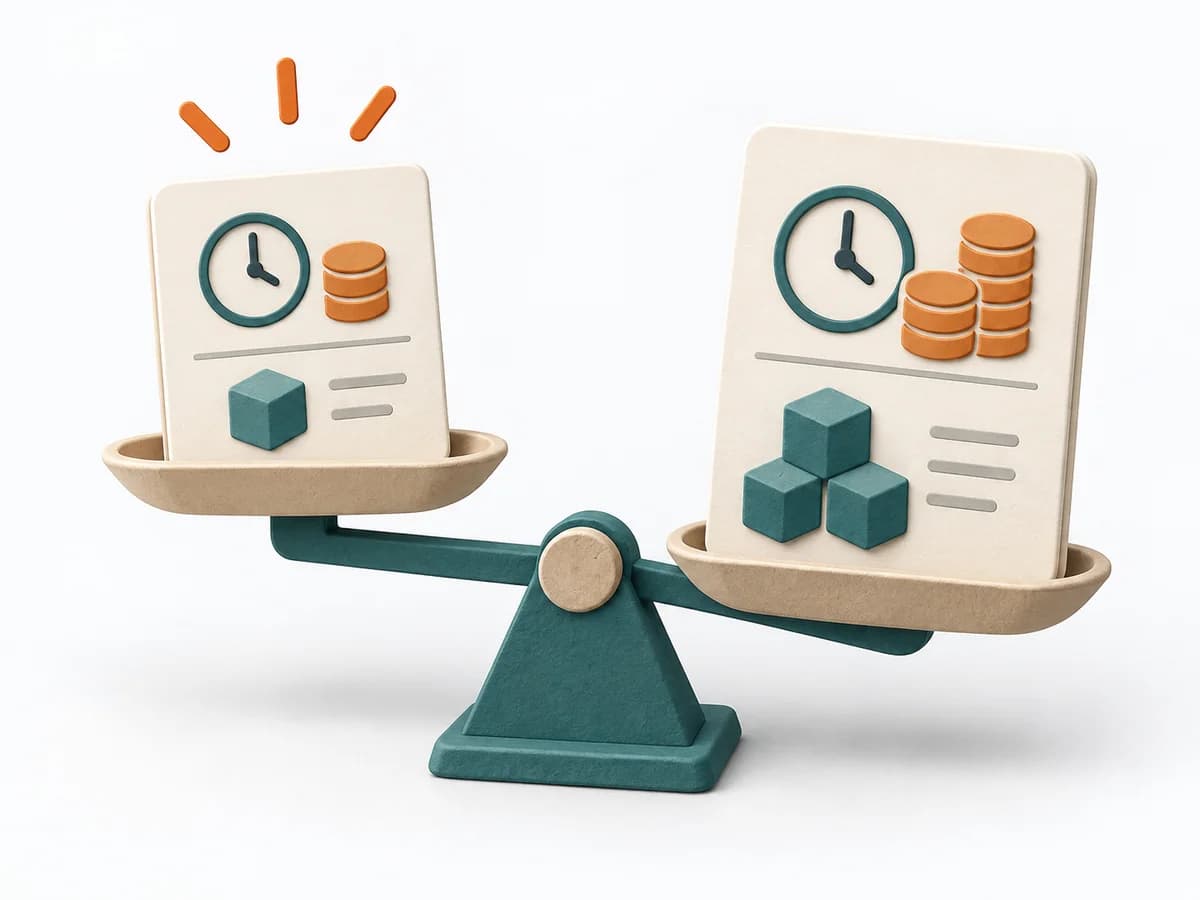 Agile WSJF | 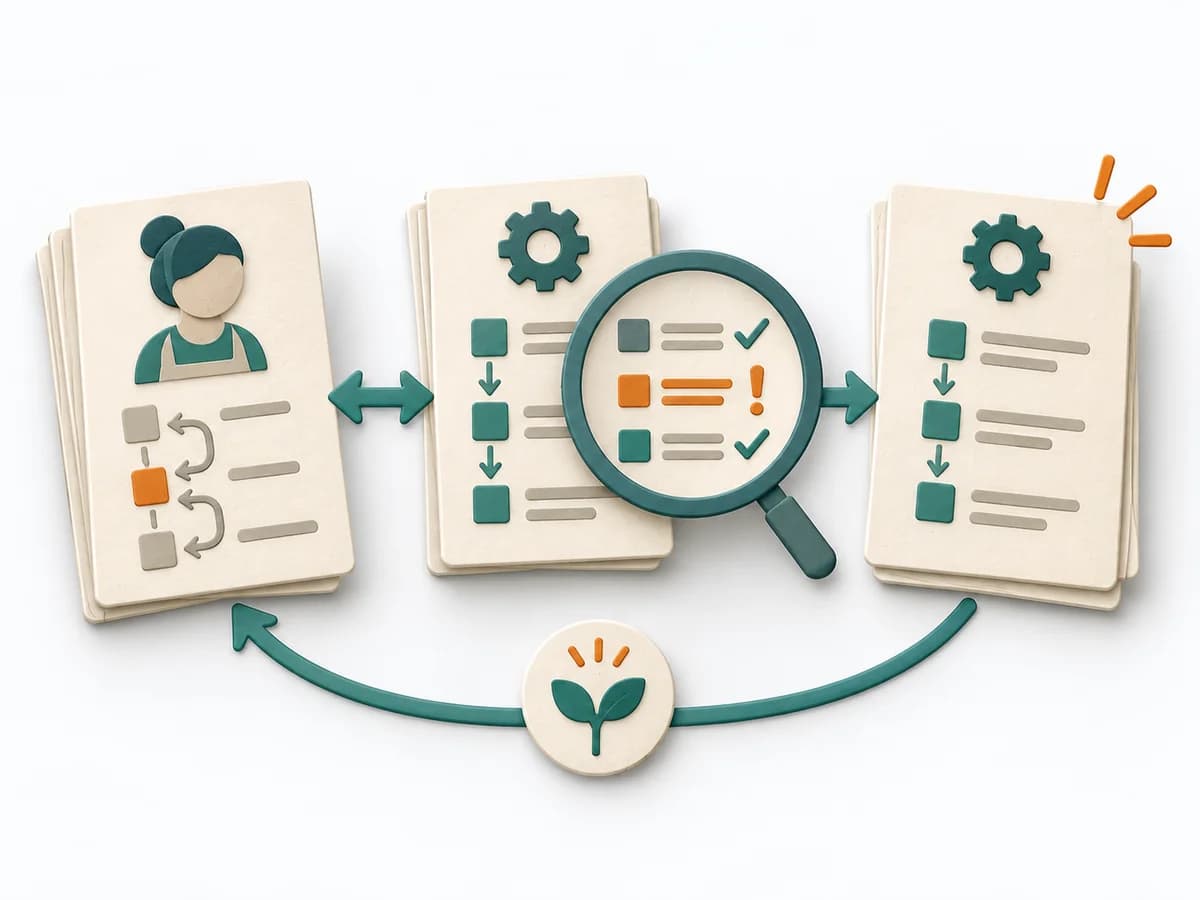 Operations Standard Work Analysis | 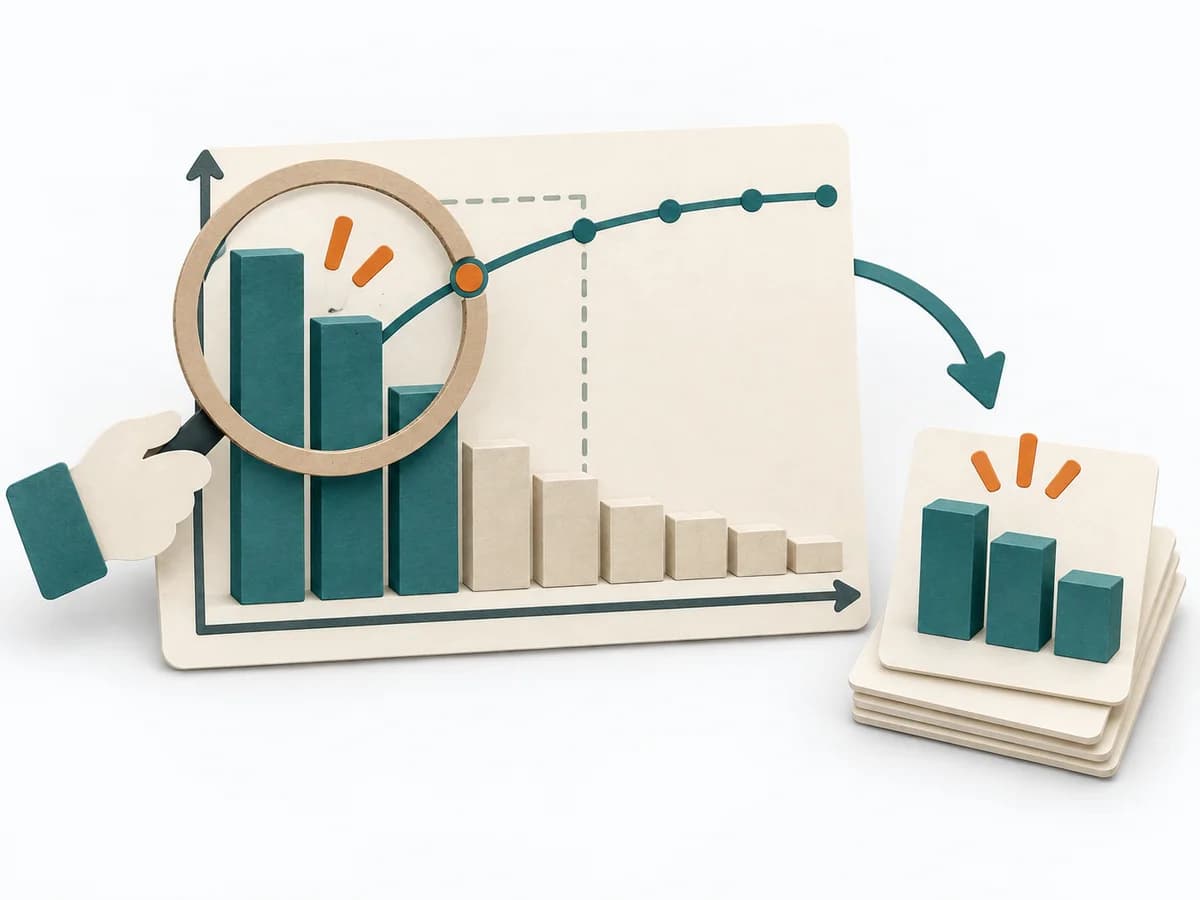 Decision Making Pareto Analysis |
|---|---|---|---|
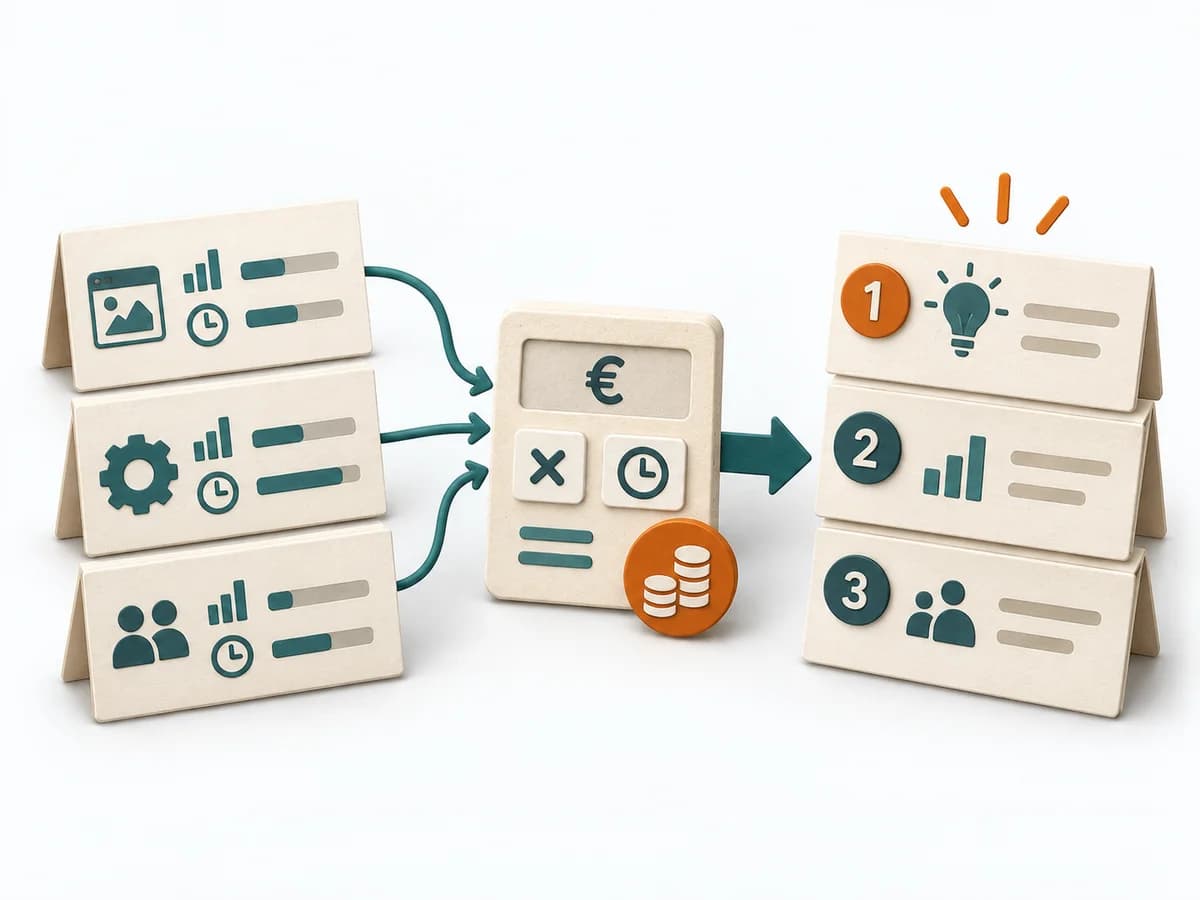
Purposedifferent | When many tasks compete for the same capacity, it orders work by economic impact. It makes time lost, benefit, and effort comparable together. | When the same task is done differently depending on the person, the method exposes the reliable core. It creates comparability without unnecessarily choking off needed latitude. | In many problem situations, effect is distributed unequally across many causes. A Pareto Analysis separates the few drivers with high leverage from the long remainder and focuses attention on what measurably moves the needle. |
Complexitydifferent | High | Medium | Low |
Timedifferent | 45-90 min | 1-3 h | 30-60 min |
Participantsdifferent | 3-10 | 2-6 | 1-6 |
Formatdifferent | Workshop | Workshop | Workshop + async |
Outputdifferent | Ranked Backlog, Cost-of-Delay Assumptions | Standard Work Sheet, Deviation List, Improved Standard, Training Needs | Pareto Chart, Top Causes, Focus List |
Tagsno overlap | LeanEconomicsSequencePrioritization | LeanProcessQuality | PrioritizationQualityFocusRoot cause |
Often compared together
Methods with strong topical overlap with the current selection, not yet in the comparison.