View methods side by side.
Choose up to four methods. Add them using the search and share the comparison by copying its link.
| Criterion | 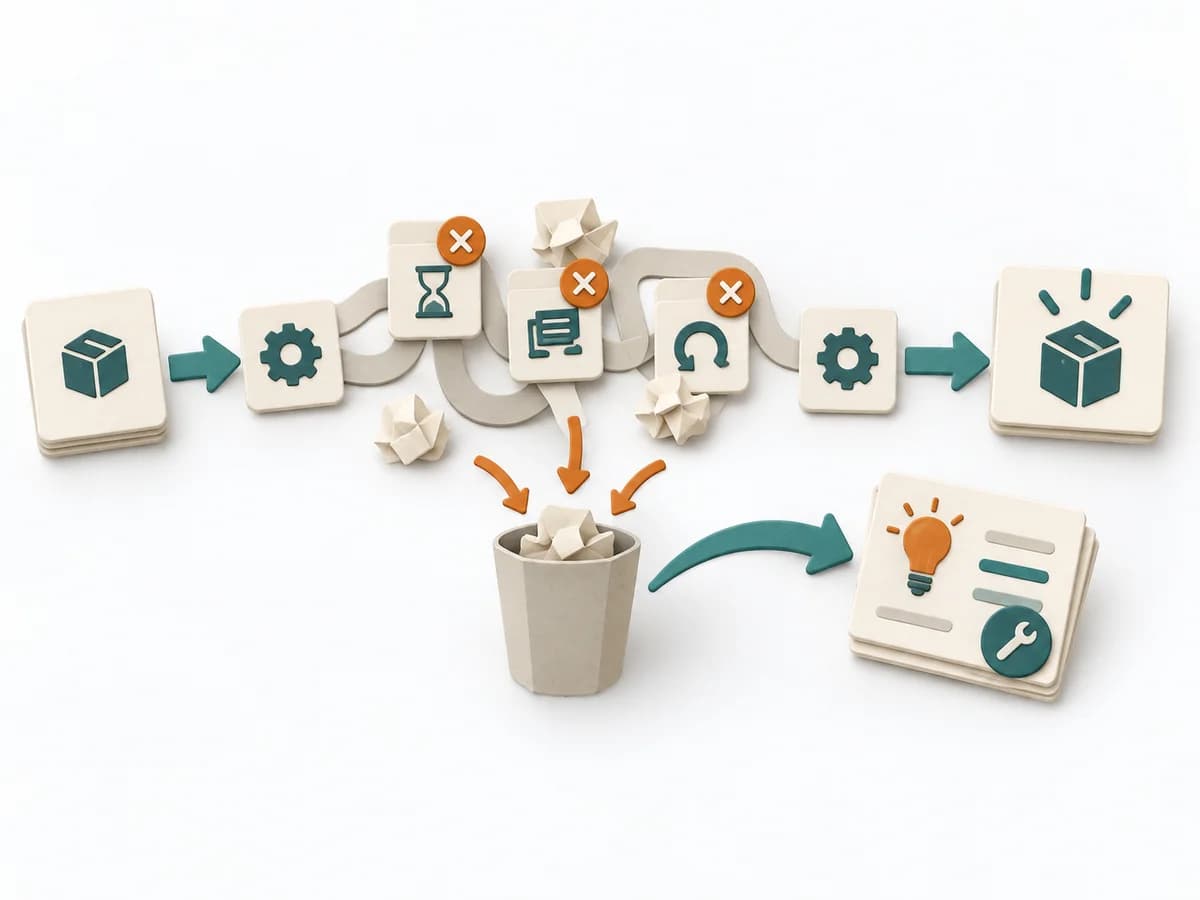 Operations Waste Analysis | 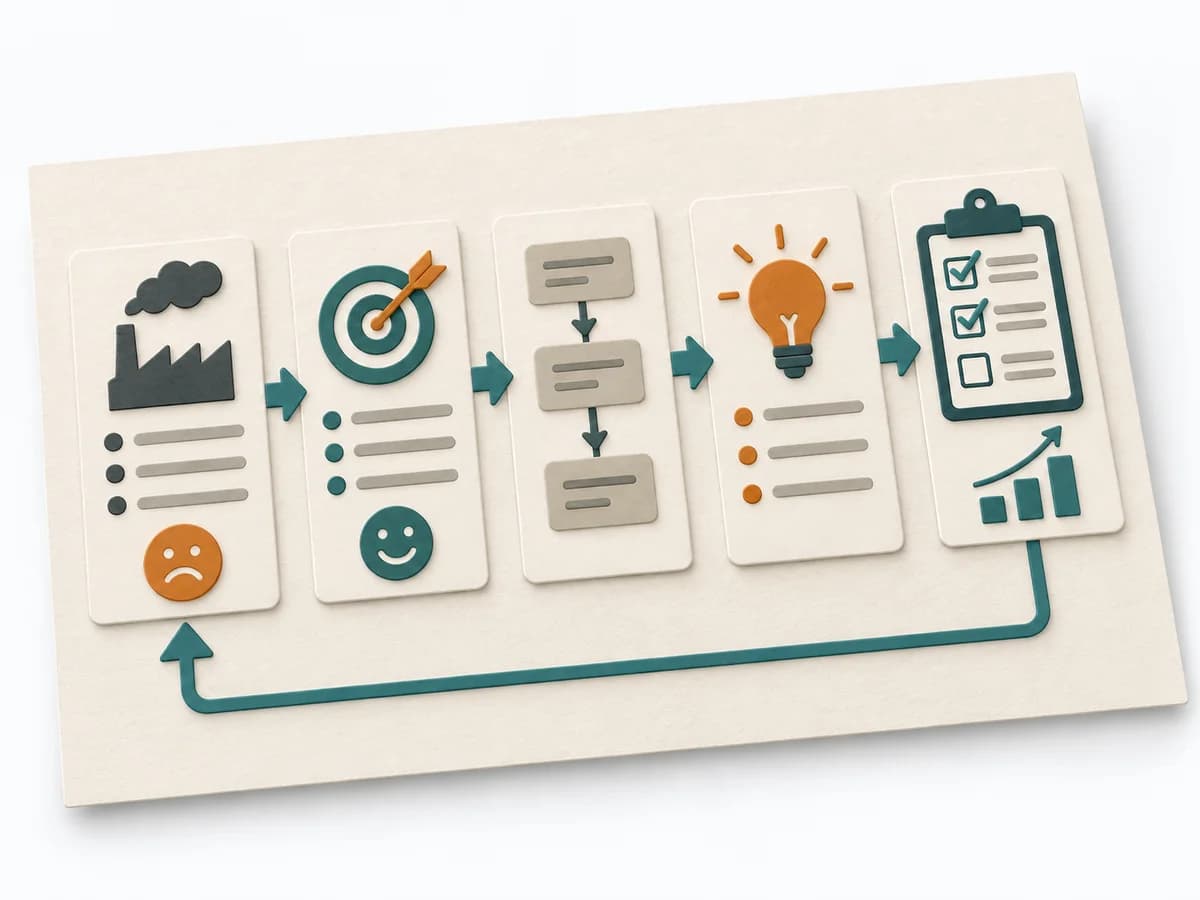 Operations A3 Problem Solving | 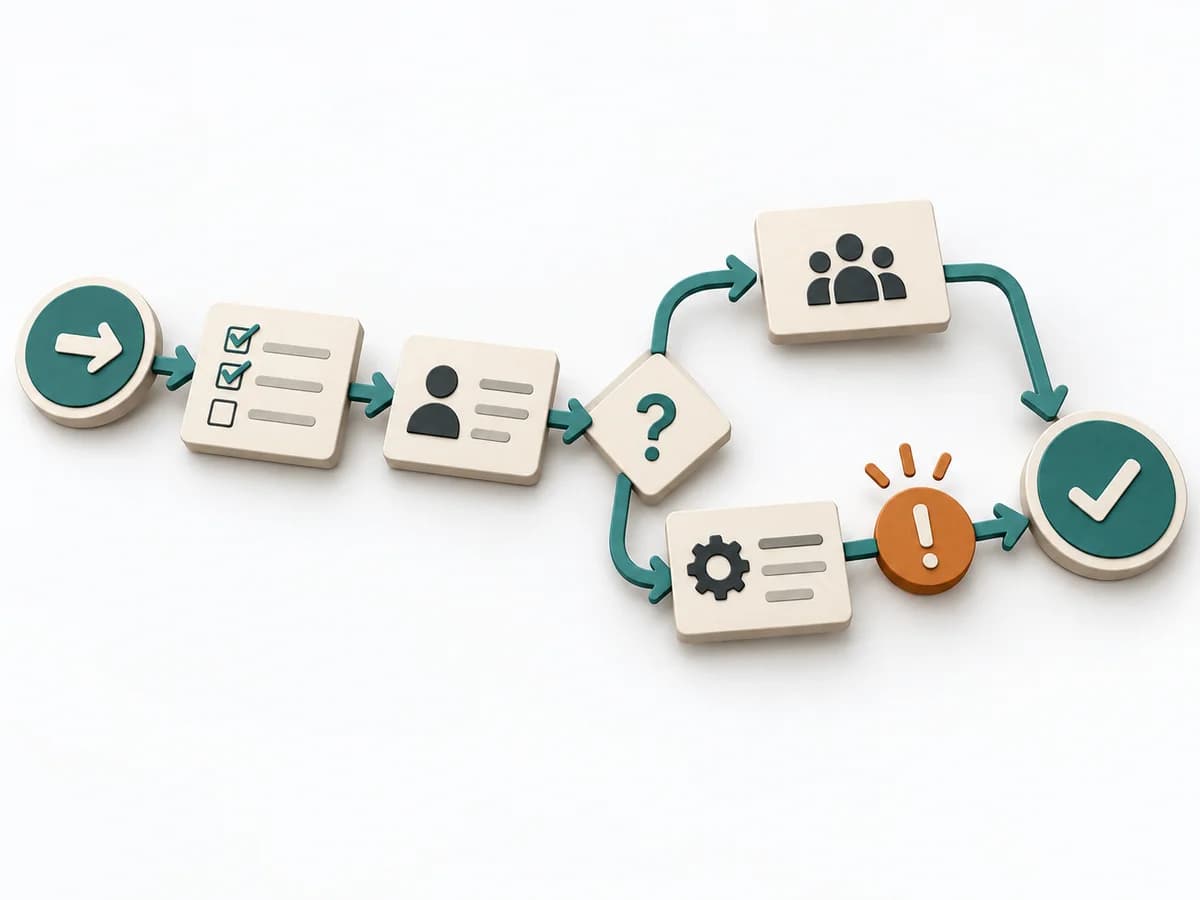 Operations Process Mapping |  Operations 5 Whys |
|---|---|---|---|---|
Purposedifferent | For a process that keeps people busy but creates little value, the method exposes waste. It directs attention to unnecessary movement, waiting times, rework, and overdelivery. | For a complex deviation with several people involved, the method bundles problem, analysis, and decision onto one page. It creates a shared working space where causes, countermeasures, and follow-up fit together. | With a confusing workflow that has many handoffs, the method makes the actual process visible. It shows where work is passed on, delayed, or duplicated, so improvement targets the right spots. | For a single, hard-to-explain deviation, the method exposes the causal chain behind the visible symptom. It keeps the cause open until a controllable condition emerges instead of a mere description. |
Complexitydifferent | Low | Medium | Medium | Low |
Timedifferent | 45-120 min | 45-90 min | 1-3 h | 15-30 min |
Participantsdifferent | 2-8 | 2-5 | 3-10 | 2-6 |
Formatdifferent | Workshop | Workshop + async | Workshop | Workshop |
Outputdifferent | Waste Map, Prioritized Waste, Improvement Backlog | A3 Report, Action Plan, Root Cause Analysis | Process Map, Handoff List, Improvement Backlog | Root cause notes, Countermeasures |
Tagsno overlap | WasteLeanProcess improvement | LeanProblem solvingCoachingOperations | ProcessOperationsImprovement | Root causeIncidentLeanProblem solving |