View methods side by side.
Choose up to four methods. Add them using the search and share the comparison by copying its link.
| Criterion |  Systems Thinking Wardley Mapping |  Systems Thinking Behavior Over Time Graph | 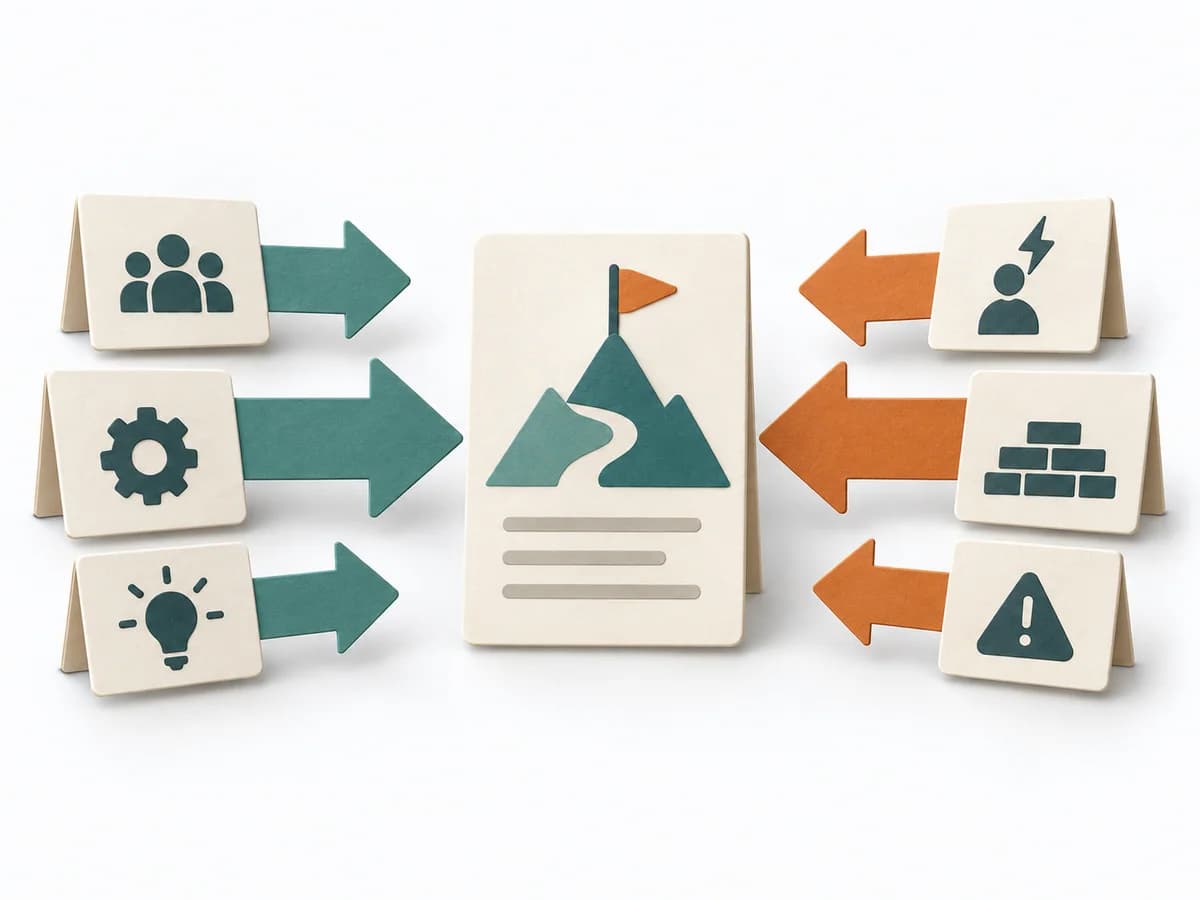 Decision Making Force Field Analysis |  Decision Making OODA Loop |
|---|---|---|---|---|
Purposedifferent | Wardley Mapping makes visible where an offering stands today and where it can evolve. The method connects user need, value chain, and evolution stages into a strategic basis for platform, build, or buy decisions. | A Behavior Over Time Graph shows how a metric or observation develops over time. The method makes trends, breaks, and recurring patterns visible that get lost in snapshots. | In change initiatives, supporting and restraining forces sit at the table at the same time. Force Field Analysis makes these tensions explicit and shows where change can be pushed forward by strengthening or relieving. | In dynamic situations, decisions become outdated faster than they can be prepared. The OODA Loop holds observing, orienting, deciding, and acting together as a recurring rhythm so reaction does not slide into inertia. |
Complexitydifferent | Medium | Low | Low | Medium |
Timedifferent | 1-3 h | 20-45 min | 45-90 min | 15-60 min je Zyklus |
Participantsdifferent | 2-10 | 1-10 | 3-12 | 1-8 |
Formatdifferent | Workshop + async | Workshop + async | Workshop | Workshop + async |
Outputdifferent | Wardley Map, Strategic Options, Evolution Notes | Behavior Over Time Graph, Trend Hypotheses, Key Events | Force Field Map, Change Levers, Risk Notes | Situation Assessment, Decision Loop, Action Updates |
Tagsno overlap | StrategySystems thinkingDynamics | Systems thinkingPatternsDynamics | ChangeDecisionStrategy | DecisionChangeLearningStrategy |