View methods side by side.
Choose up to four methods. Add them using the search and share the comparison by copying its link.
| Criterion | 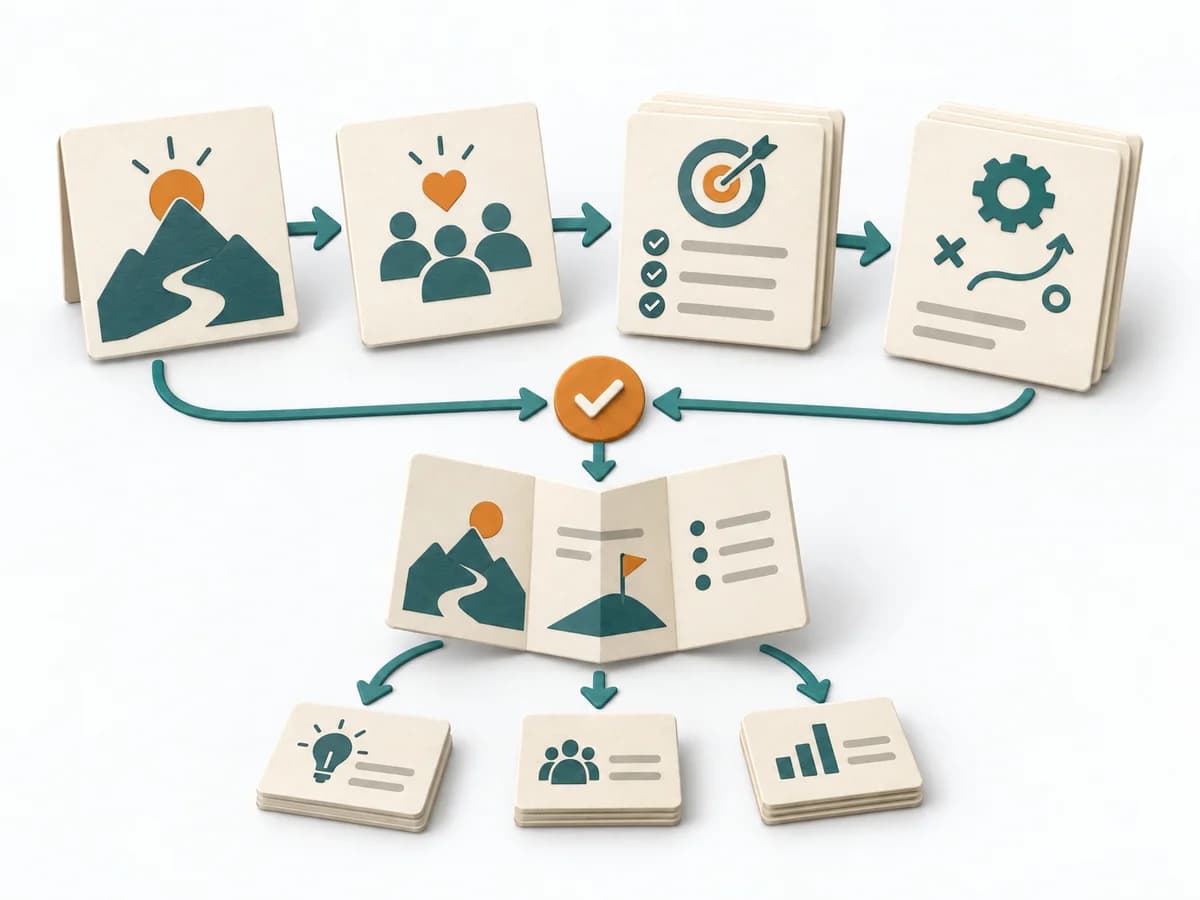 Business Strategy VMGS | 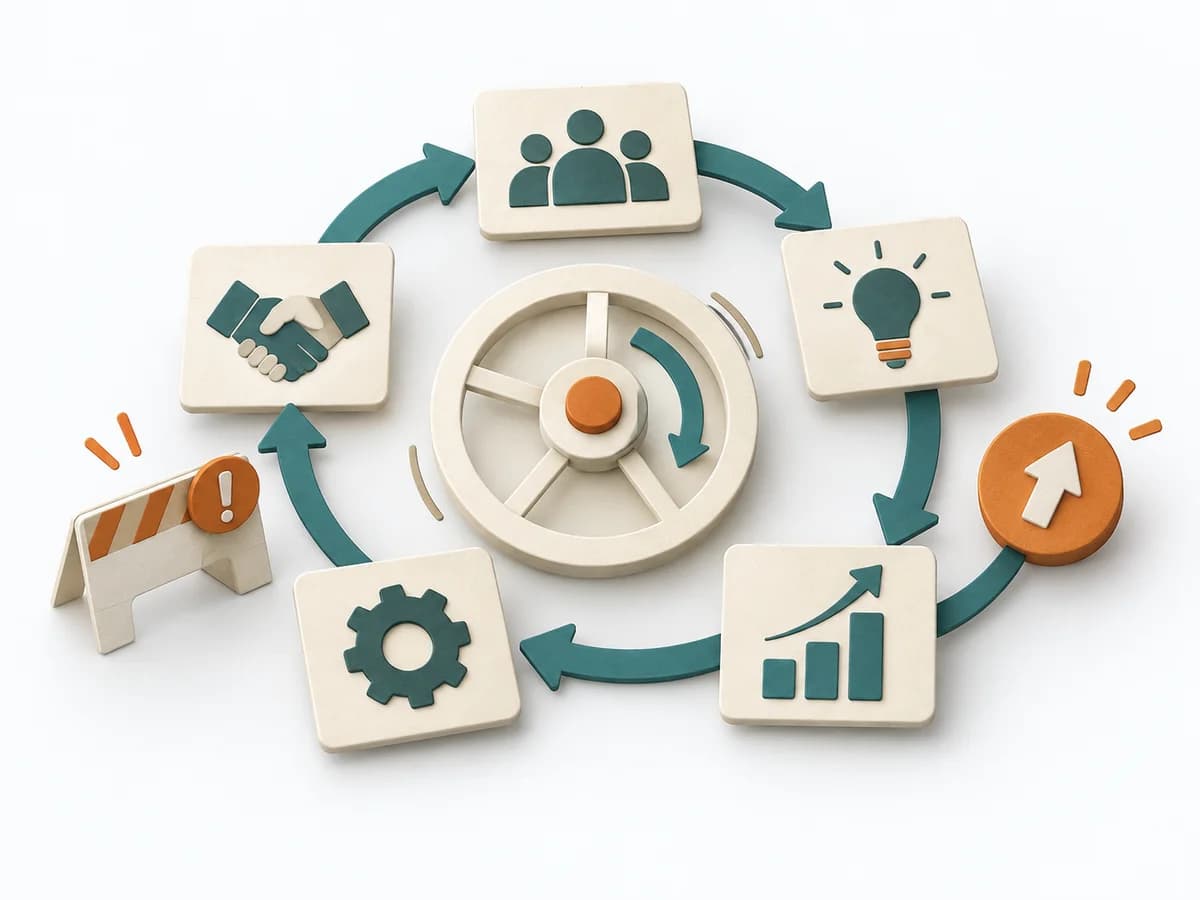 Growth Flywheel | 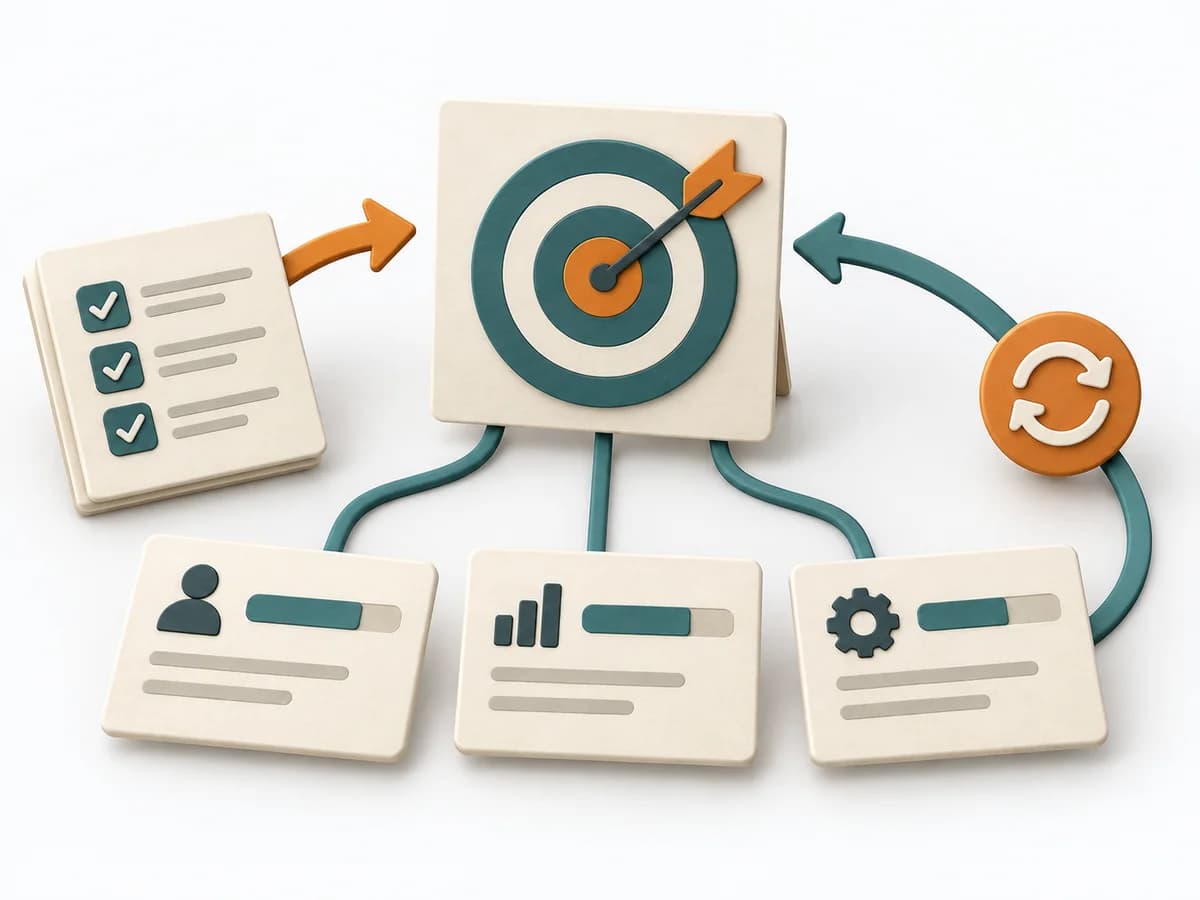 Product Strategy OKRs |
|---|---|---|---|
Purposedifferent | VMGS arranges vision, mission, goals, and strategies into a clear guiding logic. Direction, purpose, and priorities are connected so teams can decide more coherently. | Growth often breaks down where a reinforcing mechanism builds up too much friction. A Flywheel shows the cycle of value, repetition, and reinforcement meant to sustain growth. | When strategic direction needs to become measurable, it connects ambition with checkable results. It makes goals connectable to focus and review. |
Complexitysame | Medium | Medium | Medium |
Timedifferent | 2-4 h | 60-120 min | 1-2 h Setup |
Participantsdifferent | 3-12 | 3-8 | 2-20 |
Formatdifferent | Workshop | Workshop | Workshop + async |
Outputdifferent | Vision Statement, Mission Statement, Goals, Strategies | Flywheel Map, Friction Points, Growth Levers, Experiment Backlog | OKR set, Measurement plan, Review cadence |
Tagsno overlap | VisionGoalsStrategy | GrowthRetentionConversion | GoalsAlignmentOutcomesMeasurement |
Often compared together
Methods with strong topical overlap with the current selection, not yet in the comparison.