View methods side by side.
Choose up to four methods. Add them using the search and share the comparison by copying its link.
| Criterion |  Operations Visual Management | 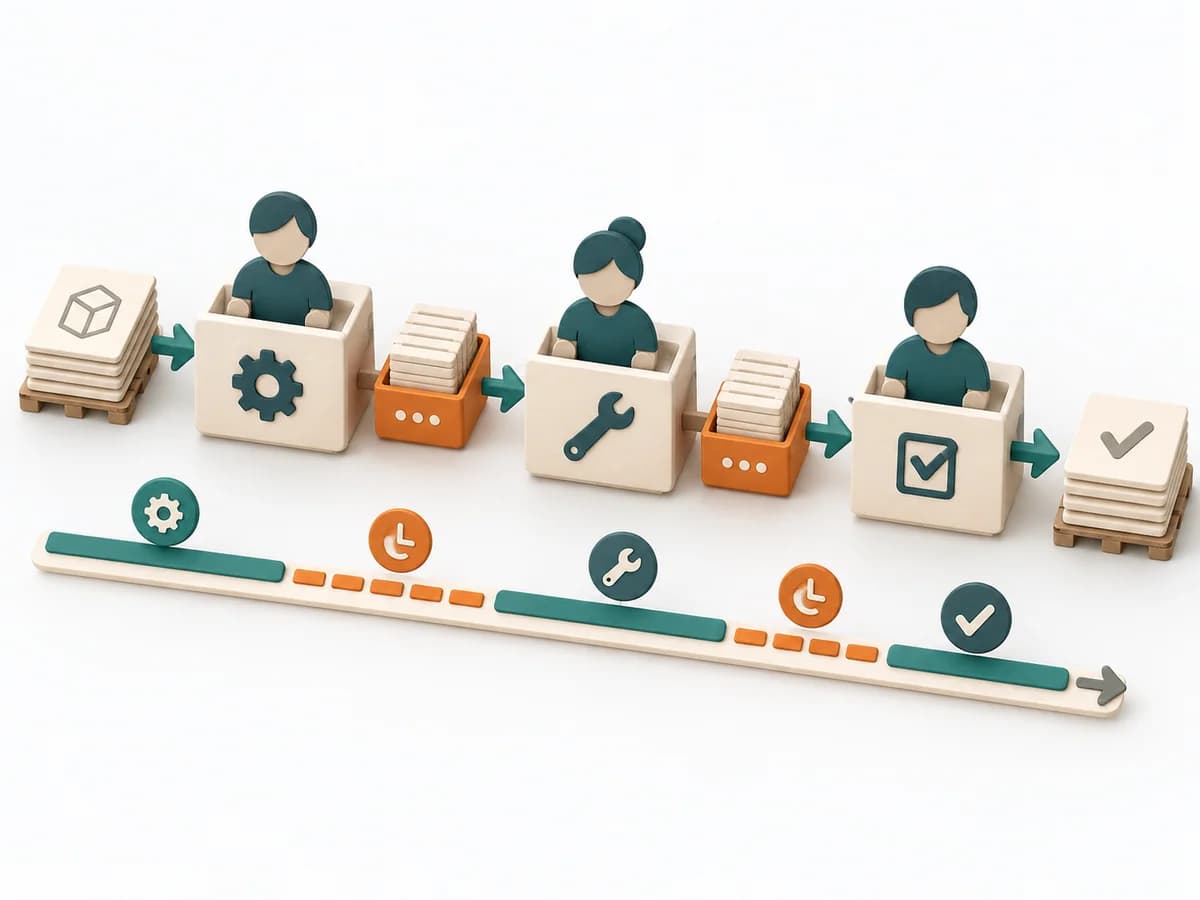 Delivery Value Stream Mapping |  Operations Failure Mode and Effects Analysis |
|---|---|---|---|
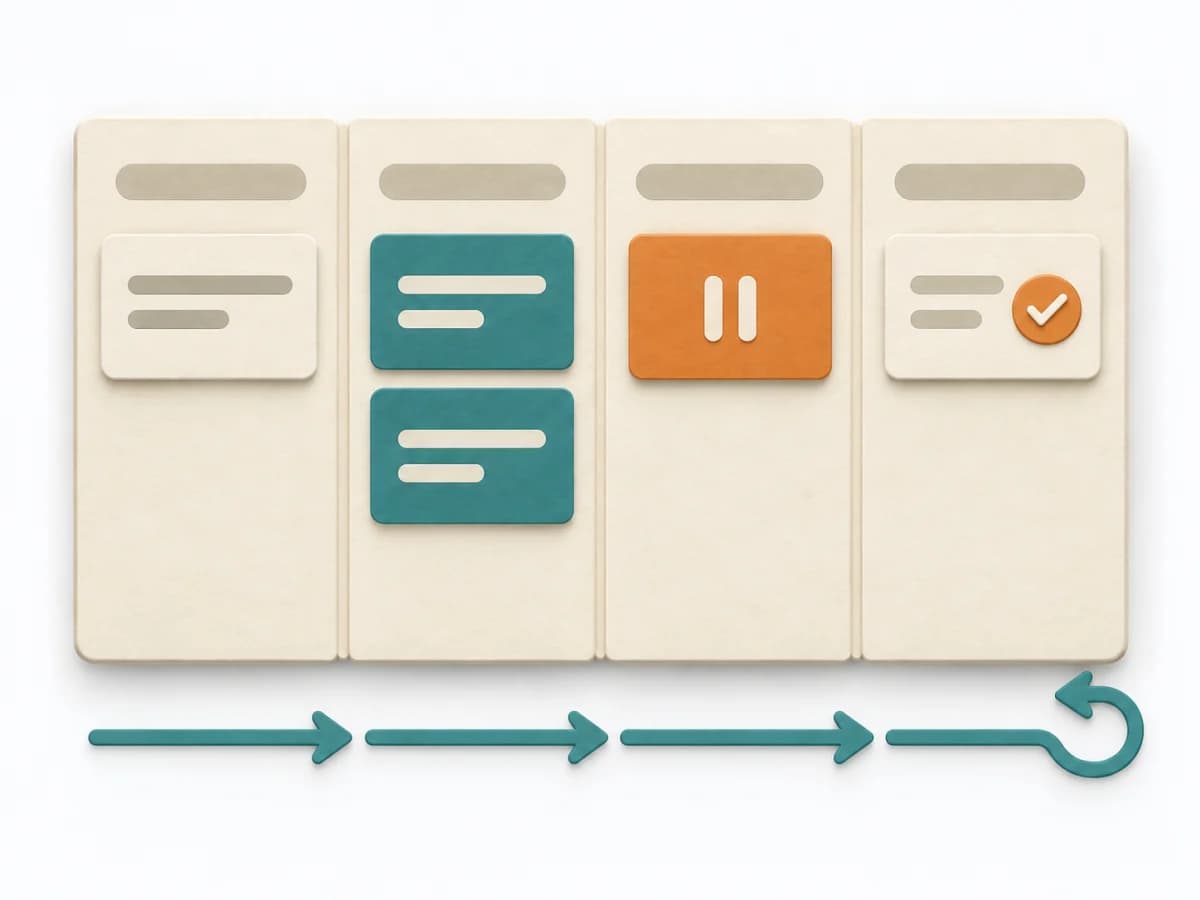
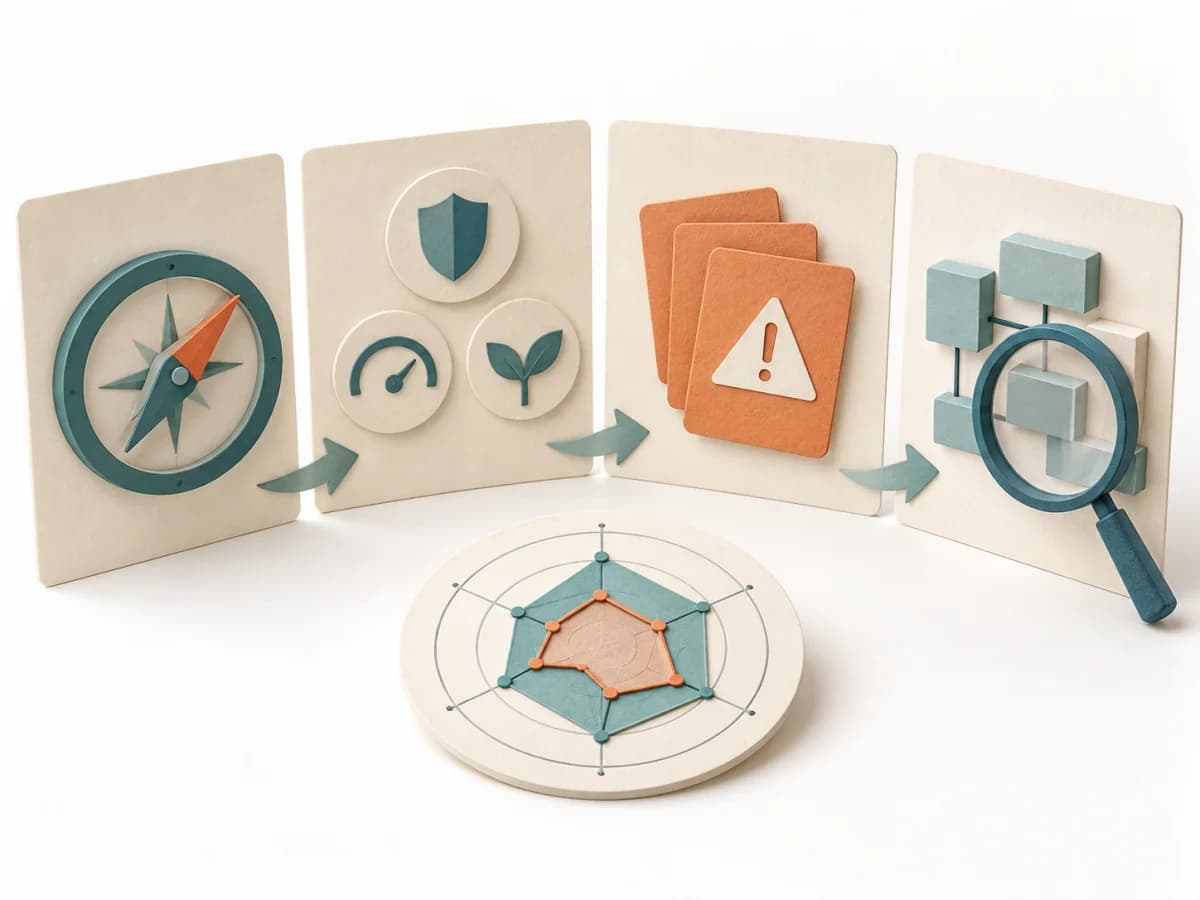
Purposedifferent | With high tempo and many parallel topics, the method makes status, deviations, and priorities visible at a glance. It reduces search effort and prevents what matters from getting lost in daily work. | When delivery work dissolves into wait times, handoffs, and hidden effort, Value Stream Mapping makes the actual flow visible. The method exposes bottlenecks, idle time, and feedback loops so lead time and improvement levers become tangible. | For a process, product, or service with noticeable failure risks, the method assesses possible failure modes in advance. It directs attention to combinations of occurrence, effect, and detectability. |
Complexitydifferent | Low | Medium | High |
Timedifferent | Ongoing | 1-3 h | 2-6 h |
Participantsdifferent | 1-20 | 4-10 | 3-10 |
Formatdifferent | Workshop + async | Workshop | Workshop |
Outputdifferent | Visual Board, Status Indicators, Exception Cues | Current-state map, Future-state map, Bottleneck list | FMEA Table, Risk Priority, Mitigation Actions |
Tagsno overlap | SignalsOperationsVisual management | LeanFlowWasteDelivery | RiskQualityOperationsRoot cause |
Often compared together
Methods with strong topical overlap with the current selection, not yet in the comparison.