View methods side by side.
Choose up to four methods. Add them using the search and share the comparison by copying its link.
| Criterion |  Operations Visual Management |  Facilitation 3-Circle Venn Diagram | 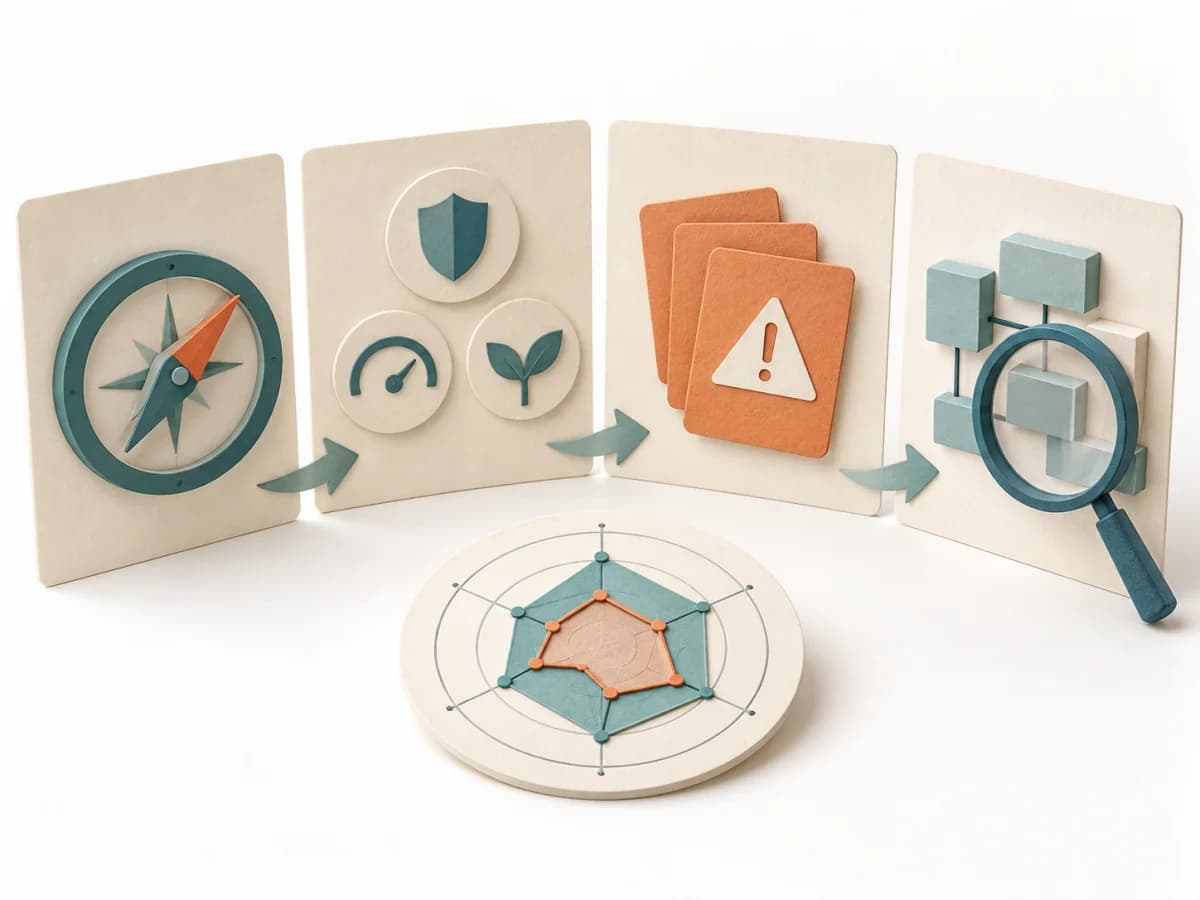 Architecture LASR (Lightweight Approach for Software Reviews) |
|---|---|---|---|
Purposedifferent | With high tempo and many parallel topics, the method makes status, deviations, and priorities visible at a glance. It reduces search effort and prevents what matters from getting lost in daily work. | When three perspectives matter at the same time, a Three-Circle Venn Diagram shows the overlaps and remainders precisely. It makes visible where shared effect arises and where only a partial perspective applies. | LASR helps development teams identify where their software falls short of important quality goals and which improvements to consider. A small group with existing system knowledge can make an initial assessment and investigate open questions in more detail. |
Complexitydifferent | Low | Low | Medium |
Timedifferent | Ongoing | 15-45 min | 3–4 h for initial assessment; preparation and deeper analysis additional |
Participantsdifferent | 1-20 | 2-8 | 1 or a small team; particularly suitable for 3–4 people |
Formatsame | Workshop + async | Workshop + async | Workshop + async |
Outputdifferent | Visual Board, Status Indicators, Exception Cues | Venn Diagram, Overlap Notes, Differentiators | Lean Mission Statement describing the software’s purpose, Prioritized quality goals and evaluation criteria, Risks and estimated gaps against quality goals, More closely examined findings and open checks |
Tagsno overlap | SignalsOperationsVisual management | ComparisonFacilitationAlignment | ArchitectureQualityRiskAssessmentLean |
Often compared together
Methods with strong topical overlap with the current selection, not yet in the comparison.