View methods side by side.
Choose up to four methods. Add them using the search and share the comparison by copying its link.
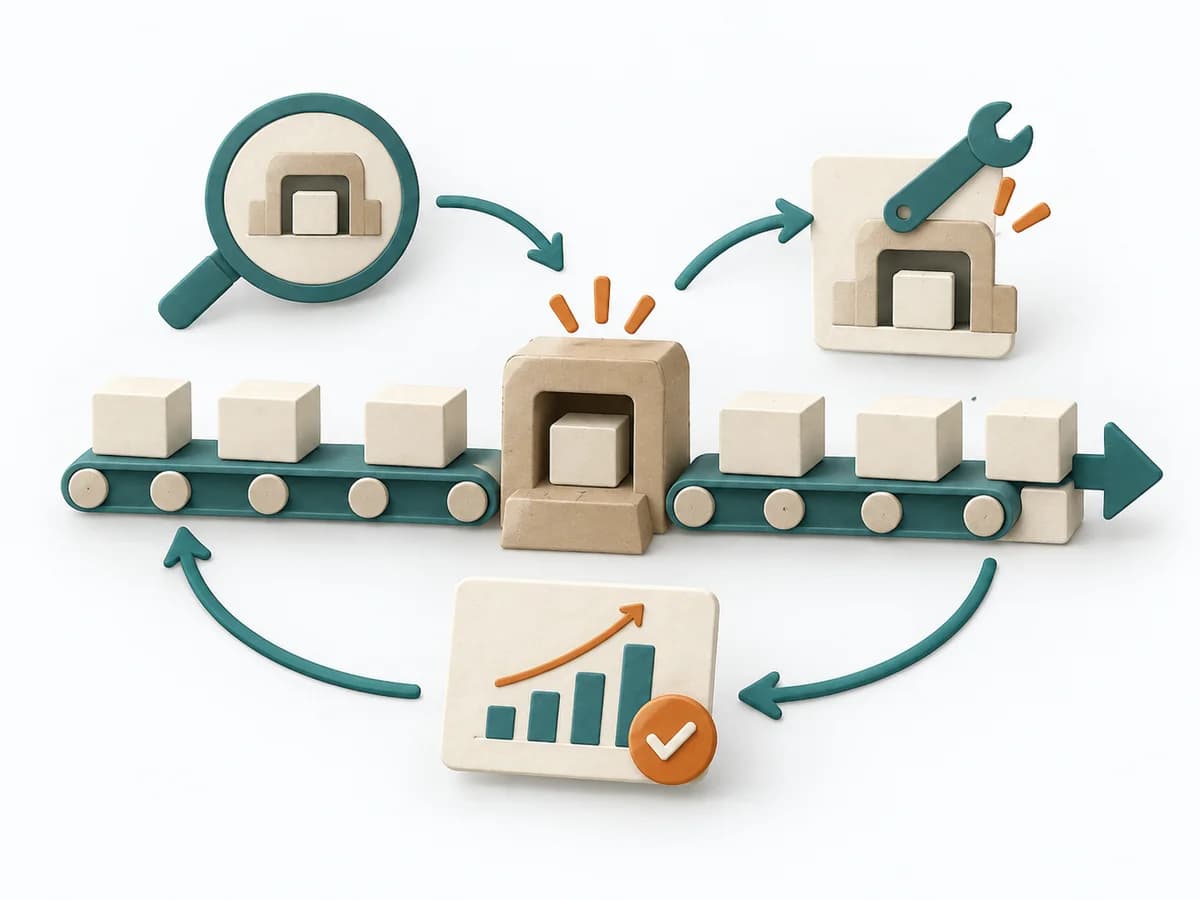
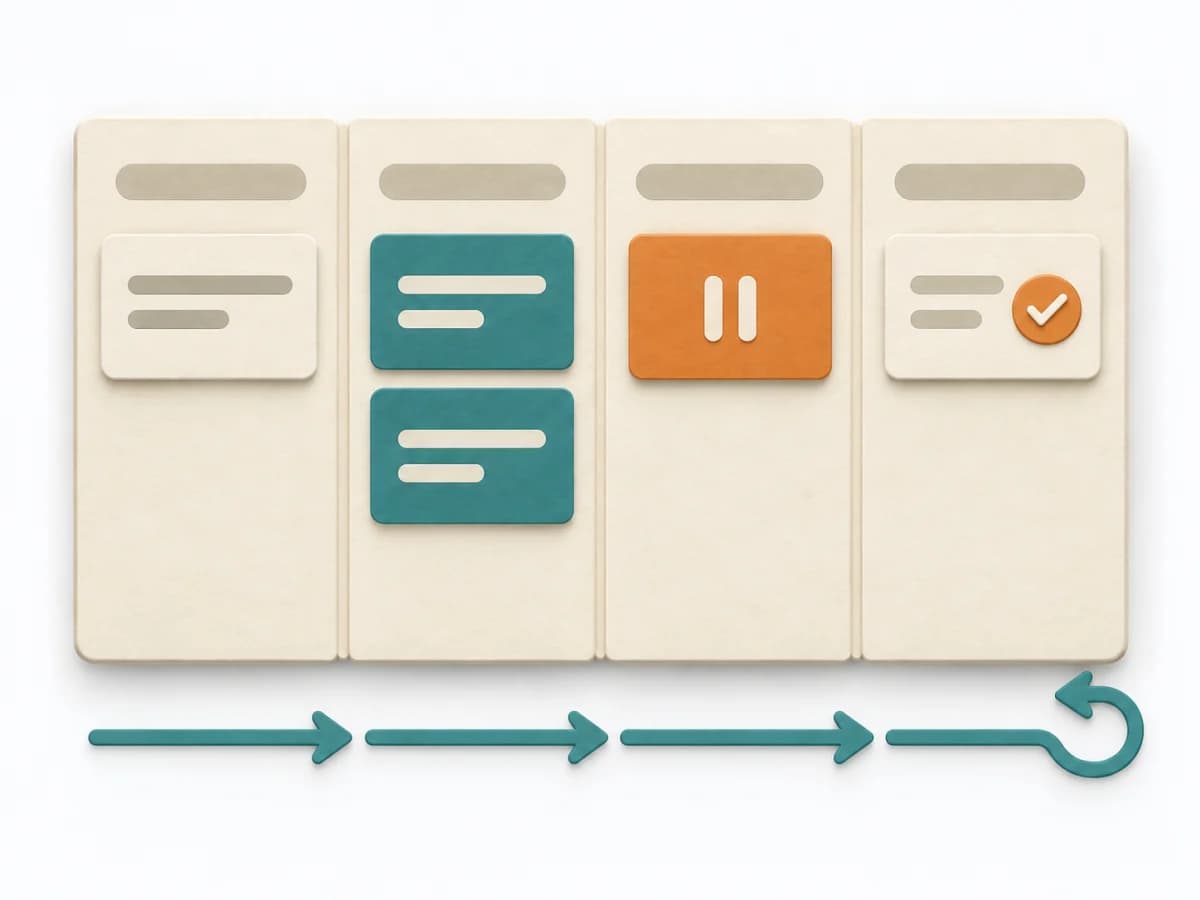
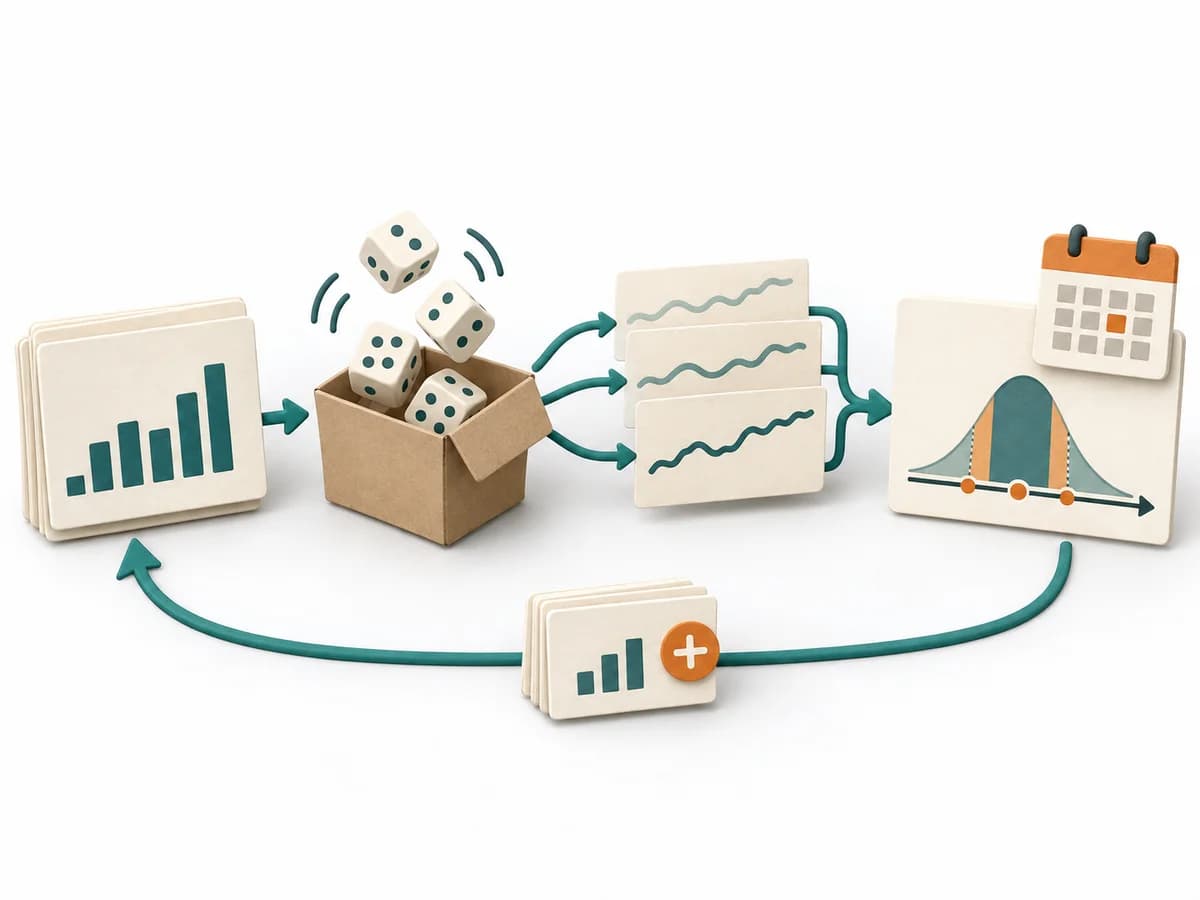
| Criterion |  Operations Visual Management | 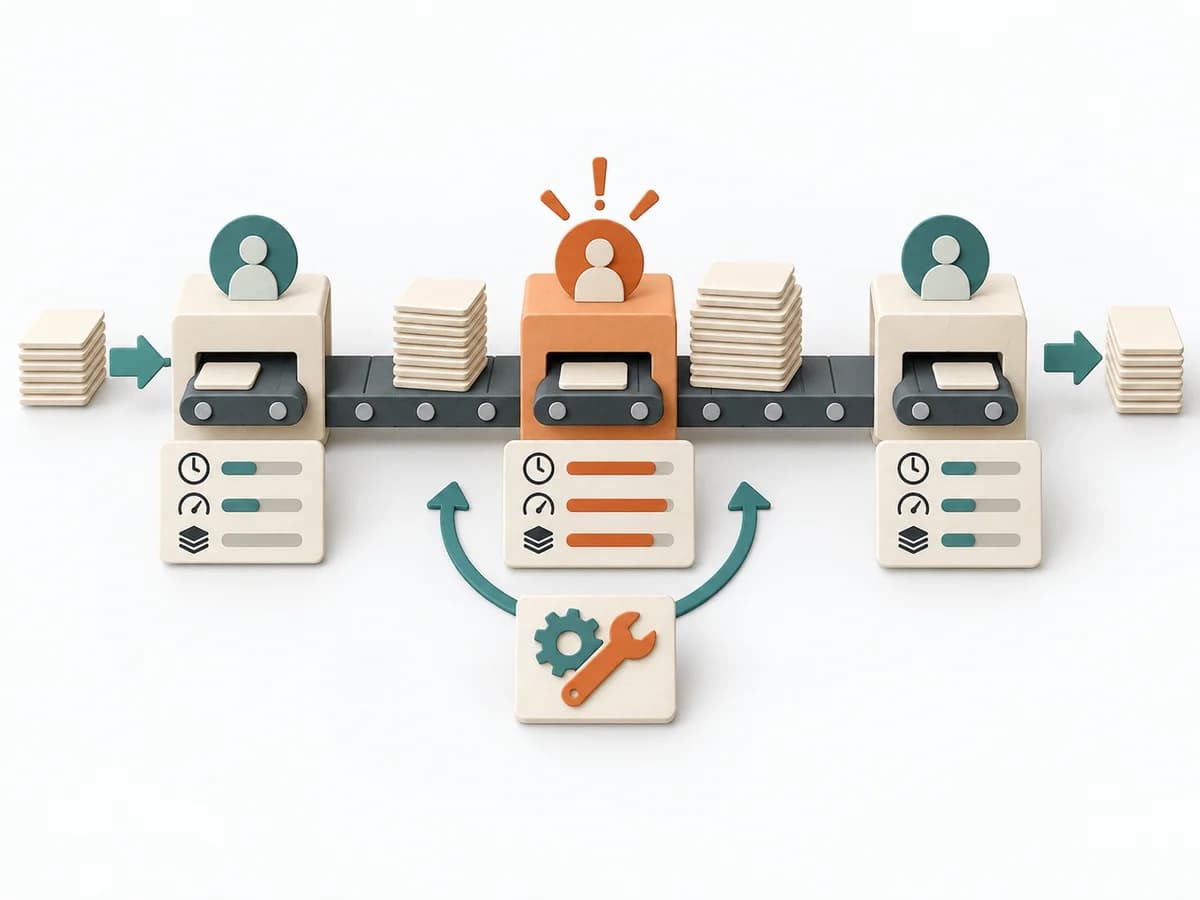 Operations Bottleneck Analysis |  Agile NoEstimates |
|---|---|---|---|
Purposedifferent | With high tempo and many parallel topics, the method makes status, deviations, and priorities visible at a glance. It reduces search effort and prevents what matters from getting lost in daily work. | For a flow that backs up at one point, the method looks for the capacity limit with the greatest leverage. It explains why extra effort elsewhere barely improves throughput. | When estimating slows a team down more than it helps, it shifts the focus to flow, small slices, and real lead time. It sorts work by value, risk, and delivery ability. The result is captured as Throughput Data, Flow Forecast, and Slicing Rules. |
Complexitydifferent | Low | Medium | Medium |
Timedifferent | Ongoing | 1-3 h | laufend |
Participantsdifferent | 1-20 | 3-8 | 2-12 |
Formatsame | Workshop + async | Workshop + async | Workshop + async |
Outputdifferent | Visual Board, Status Indicators, Exception Cues | Bottleneck Map, Flow Metrics, Improvement Options, Follow-up Measures | Throughput Data, Flow Forecast, Slicing Rules |
Tagsno overlap | SignalsOperationsVisual management | FlowMeasurementConstraints | EstimationForecastingFlow |
Often compared together
Methods with strong topical overlap with the current selection, not yet in the comparison.