View methods side by side.
Choose up to four methods. Add them using the search and share the comparison by copying its link.
| Criterion | 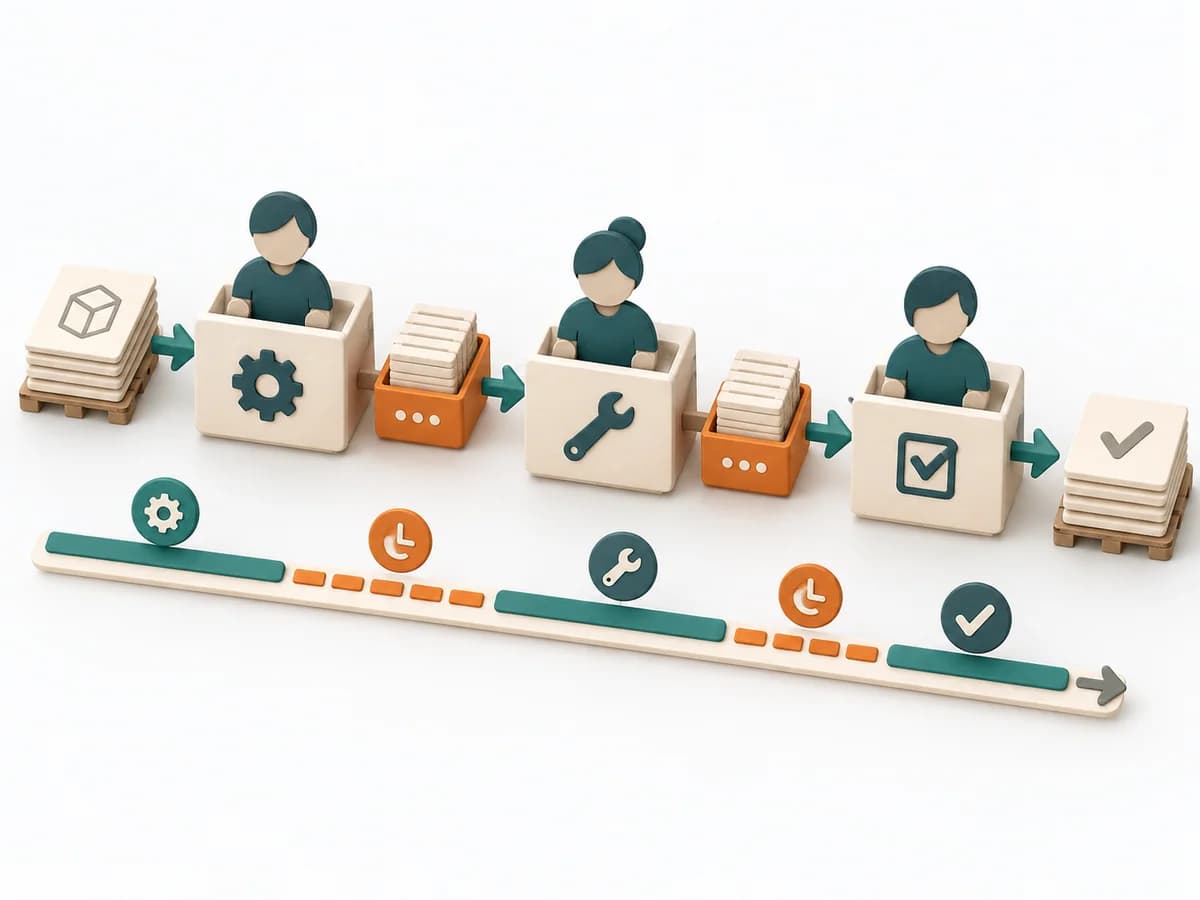 Delivery Value Stream Mapping | 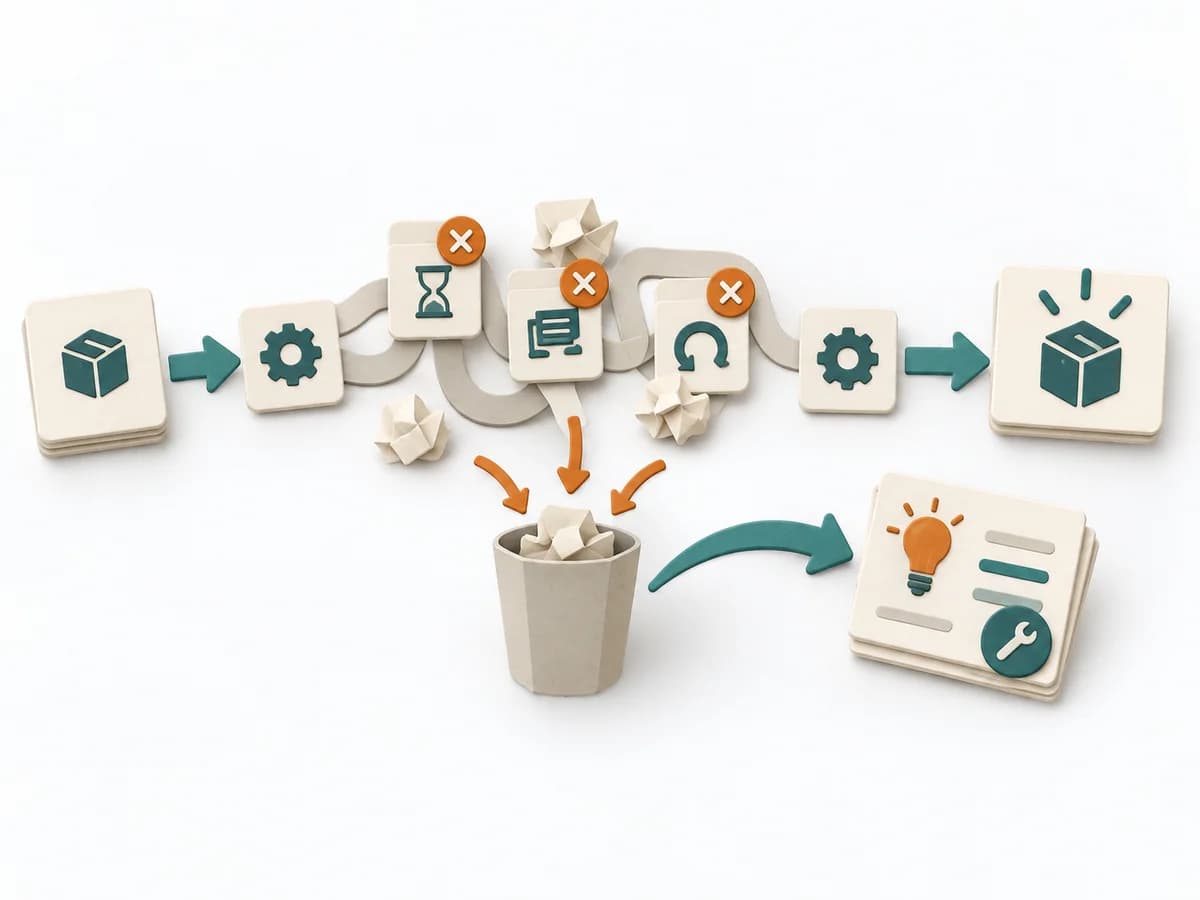 Operations Waste Analysis | 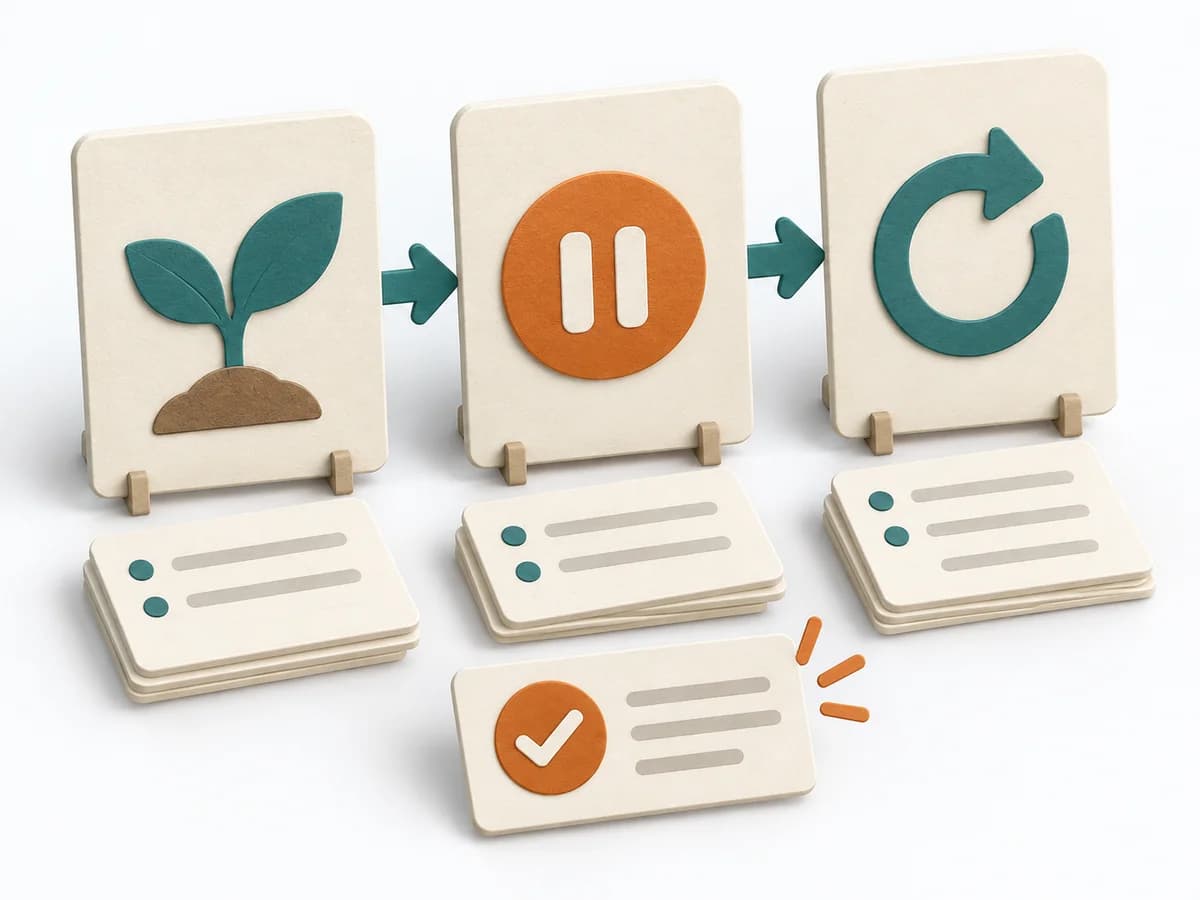 Agile Start Stop Continue | 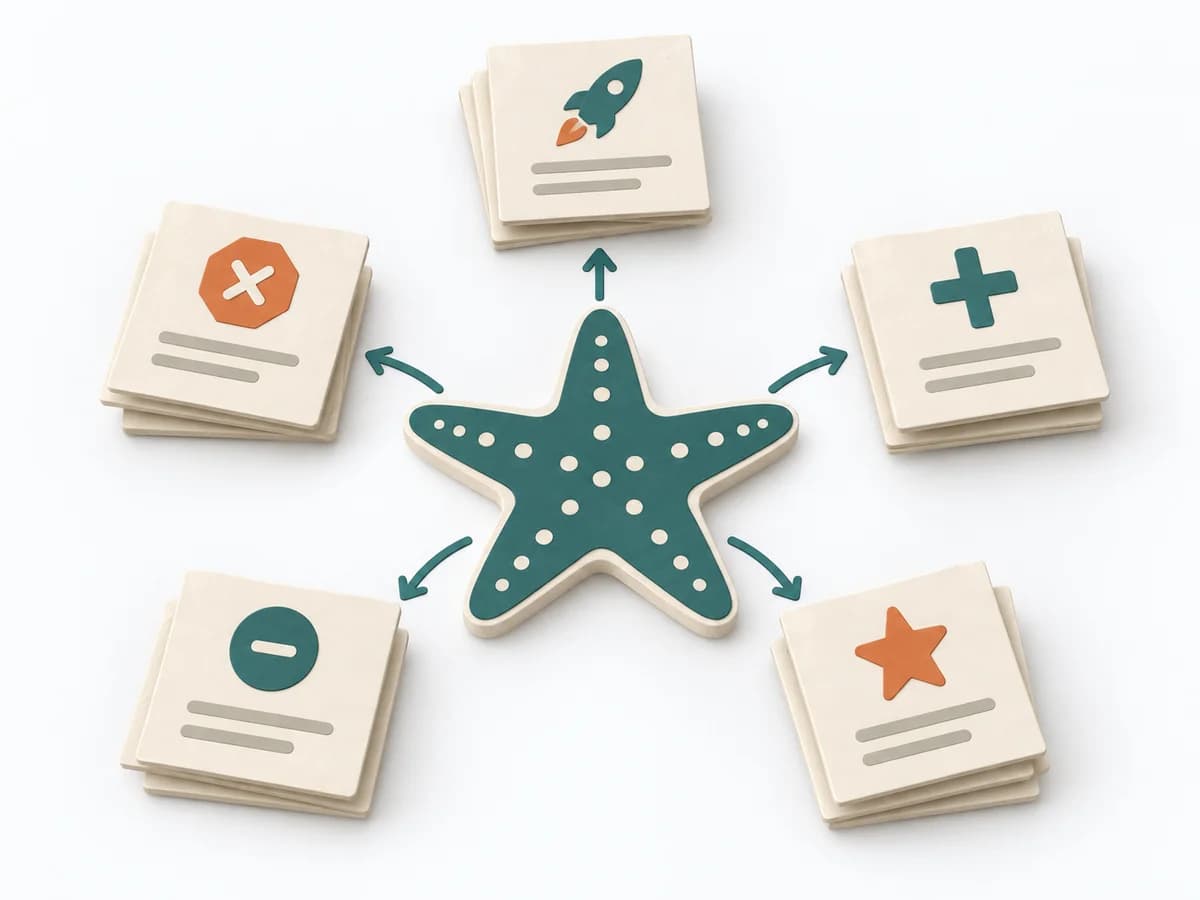 Agile Starfish Retrospective |
|---|---|---|---|---|
Purposedifferent | When delivery work dissolves into wait times, handoffs, and hidden effort, Value Stream Mapping makes the actual flow visible. The method exposes bottlenecks, idle time, and feedback loops so lead time and improvement levers become tangible. | For a process that keeps people busy but creates little value, the method exposes waste. It directs attention to unnecessary movement, waiting times, rework, and overdelivery. | When a team wants to deliberately adjust its working behavior, it makes habits visible and assessable. It focuses on concrete changes instead of diffuse mood. | When improvement options need to be sorted more finely than just start and stop, it brings observations into clear kinds of action. This makes visible what should be done more, less, newly, or continued. |
Complexitydifferent | Medium | Low | Low | Low |
Timedifferent | 1-3 h | 45-120 min | 30-60 min | 45-90 min |
Participantsdifferent | 4-10 | 2-8 | 3-12 | 4-12 |
Formatsame | Workshop | Workshop | Workshop | Workshop |
Outputdifferent | Current-state map, Future-state map, Bottleneck list | Waste Map, Prioritized Waste, Improvement Backlog | Start Stop Continue Board, Improvement Actions | Starfish Board, Practice Changes, Experiments |
Tagsno overlap | LeanFlowWasteDelivery | WasteLeanProcess improvement | RetrospectiveImprovementTeamReflection | RetrospectiveImprovementExperimentsTeam |