View methods side by side.
Choose up to four methods. Add them using the search and share the comparison by copying its link.
| Criterion |  Delivery Value Stream Mapping |  Product Strategy Lean Canvas |  Systems Thinking Current Reality Tree | 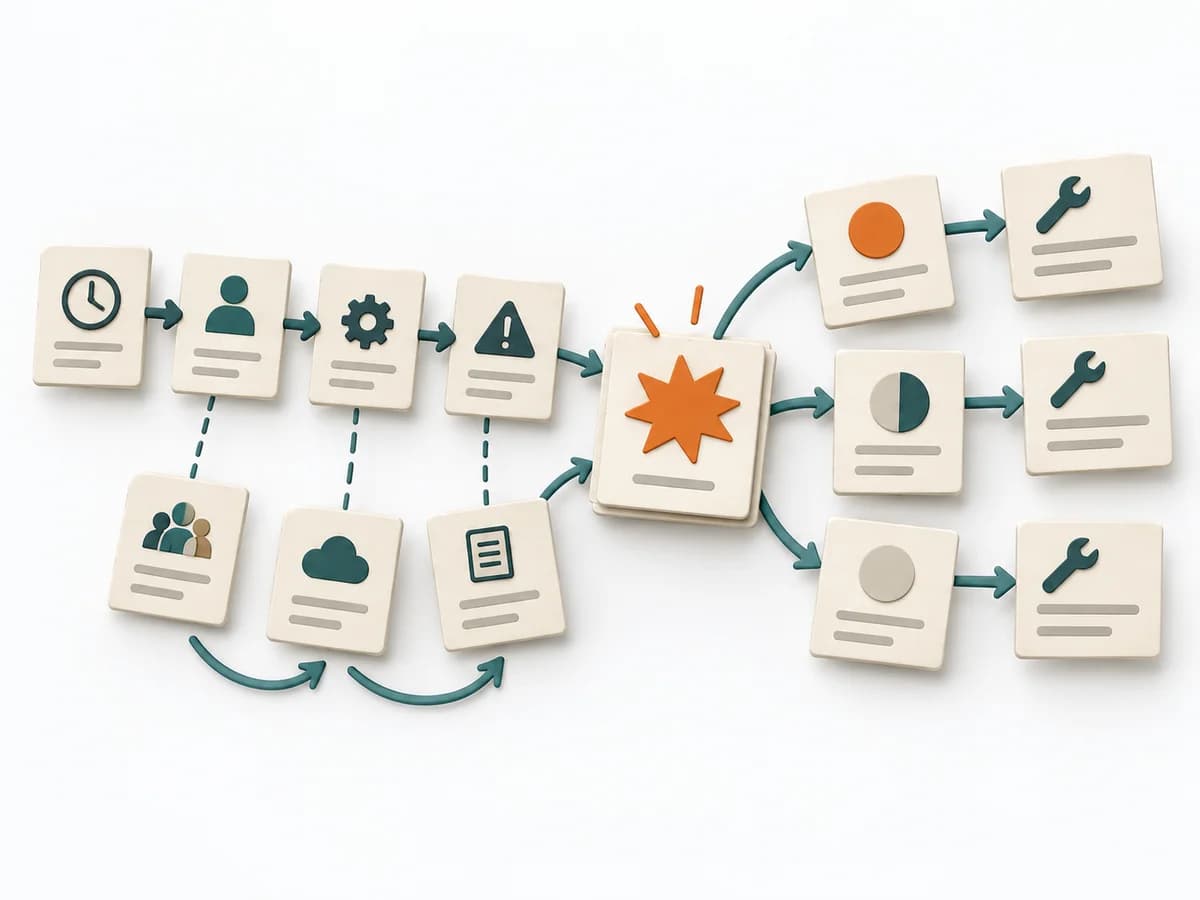 Operations Causal Factor Analysis |
|---|---|---|---|---|
Purposedifferent | When delivery work dissolves into wait times, handoffs, and hidden effort, Value Stream Mapping makes the actual flow visible. The method exposes bottlenecks, idle time, and feedback loops so lead time and improvement levers become tangible. | When an early product bet still has too many open points, it brings target group, problem, and assumptions into a single view. It condenses the idea so core risks become nameable. | A Current Reality Tree condenses many symptoms into a few causal chains. The method makes visible which core problems drive several negative effects at once. | For an event with a complicated course, the method breaks down the contributing factors along the timeline. It shows how conditions, decisions, and reactions together produce a course of events. |
Complexitydifferent | Medium | Medium | High | High |
Timedifferent | 1-3 h | 45-90 min | 2-6 h | 2-6 h |
Participantsdifferent | 4-10 | 1-6 | 3-8 | 3-10 |
Formatdifferent | Workshop | Workshop + async | Workshop | Workshop + async |
Outputdifferent | Current-state map, Future-state map, Bottleneck list | Lean Canvas, Core Assumptions, Experiment Backlog | Current Reality Tree, Core Problems, Intervention Ideas | Event Timeline, Causal Factor Chart, Cause List, Corrective Actions |
Tagsno overlap | LeanFlowWasteDelivery | StartupLeanAssumptionsBusiness model | Systems thinkingRoot causeConstraintsCausality | CausalityIncidentRoot causeTimeline |