View methods side by side.
Choose up to four methods. Add them using the search and share the comparison by copying its link.
| Criterion |  Delivery Value Stream Mapping | 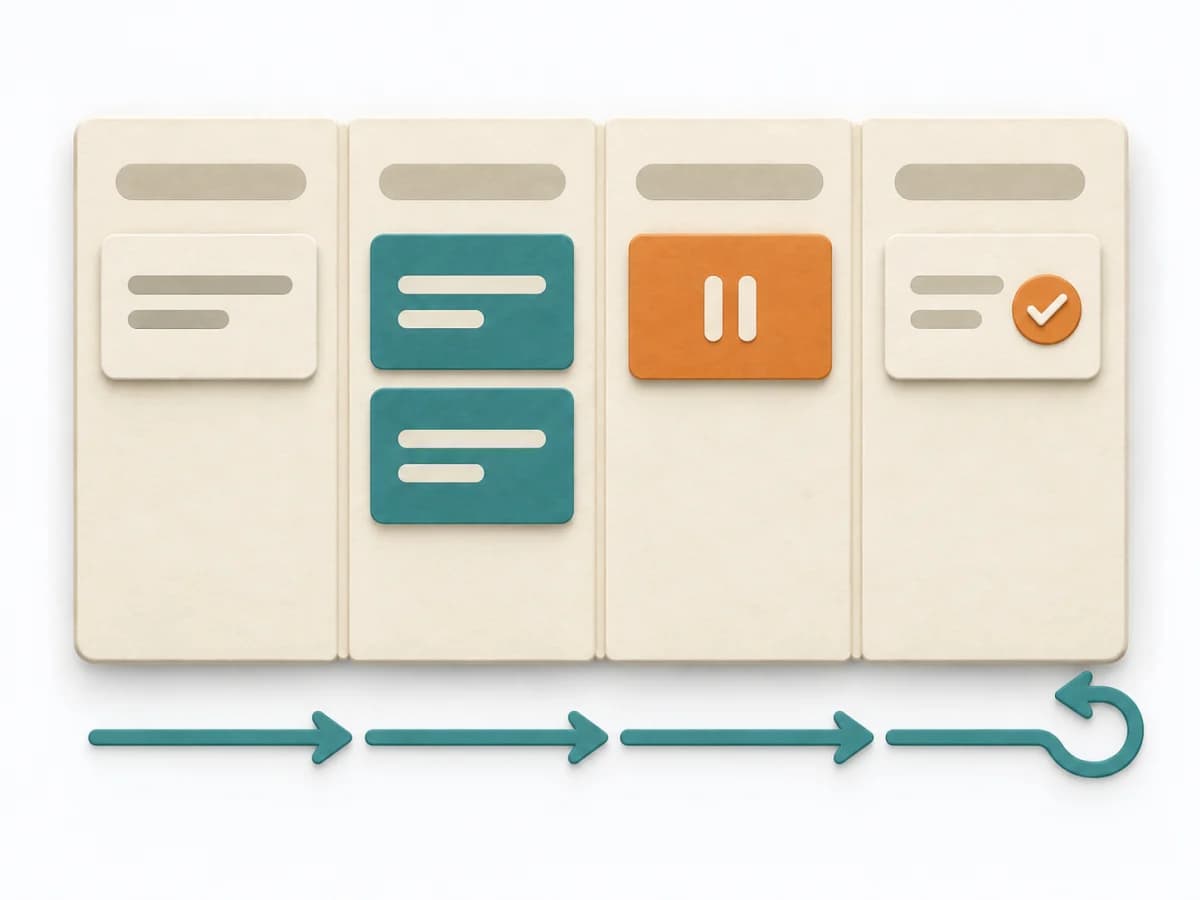 Engineering Kanban | 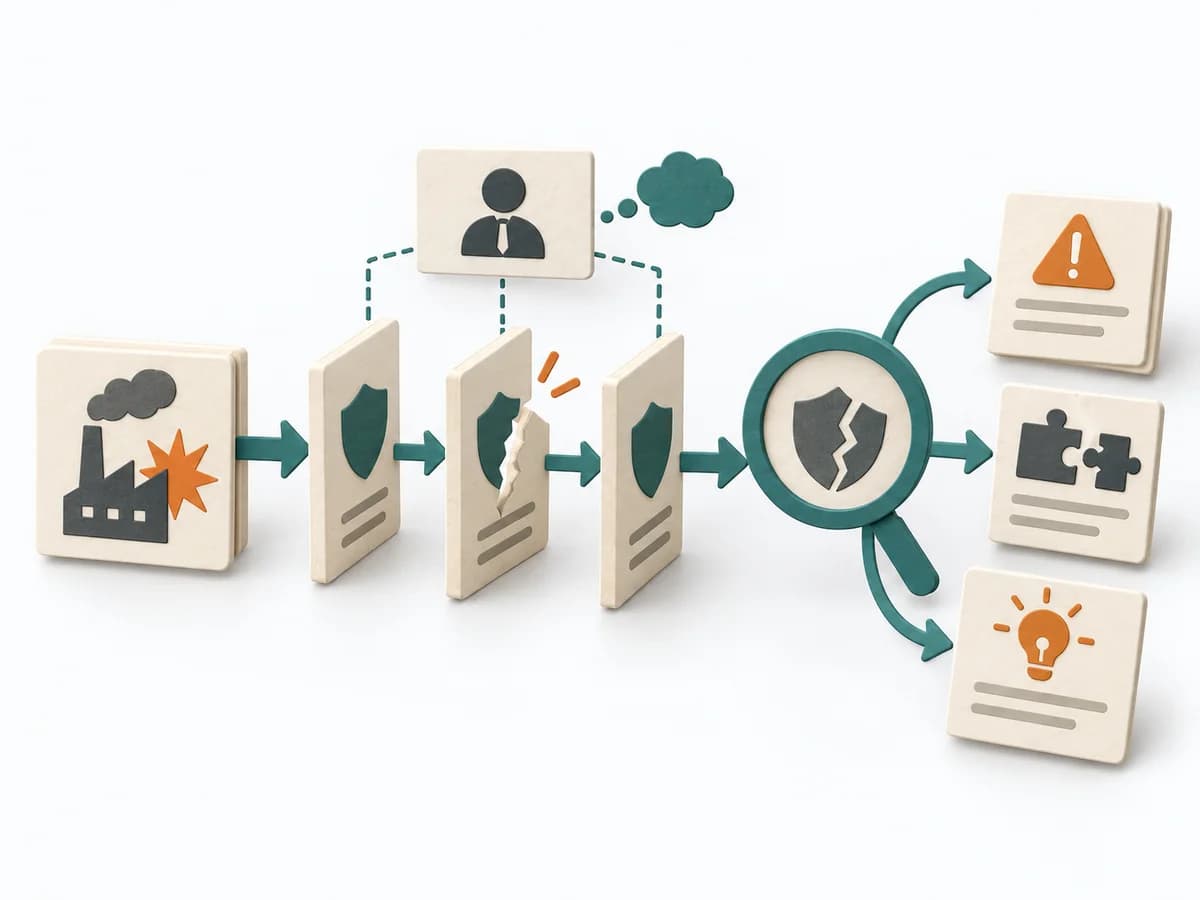 Operations MORT Analysis |  Operations 5 Whys |
|---|---|---|---|---|
Purposedifferent | When delivery work dissolves into wait times, handoffs, and hidden effort, Value Stream Mapping makes the actual flow visible. The method exposes bottlenecks, idle time, and feedback loops so lead time and improvement levers become tangible. | When work sits in too many parallel streams, throughput suffers and no one sees the bottlenecks. Kanban makes the flow of work visible and limits overload so a system becomes calmer and more predictable. | For a safety-relevant event or a system with high protection requirements, the method examines where controls failed. It exposes both technical and organizational gaps. | For a single, hard-to-explain deviation, the method exposes the causal chain behind the visible symptom. It keeps the cause open until a controllable condition emerges instead of a mere description. |
Complexitydifferent | Medium | Medium | High | Low |
Timedifferent | 1-3 h | Ongoing | Mehrere Tage bis Wochen | 15-30 min |
Participantsdifferent | 4-10 | 2-12 | 2-6 | 2-6 |
Formatdifferent | Workshop | Workshop + async | Workshop + async | Workshop |
Outputdifferent | Current-state map, Future-state map, Bottleneck list | Kanban board, WIP policies, Flow metrics | MORT Worksheets, Findings per Branch, Corrective Actions, Systemic Recommendations | Root cause notes, Countermeasures |
Tagsno overlap | LeanFlowWasteDelivery | FlowVisual managementDelivery | Root causeSafetySystemicIncident | Root causeIncidentLeanProblem solving |