View methods side by side.
Choose up to four methods. Add them using the search and share the comparison by copying its link.
| Criterion |  Delivery Value Stream Mapping | 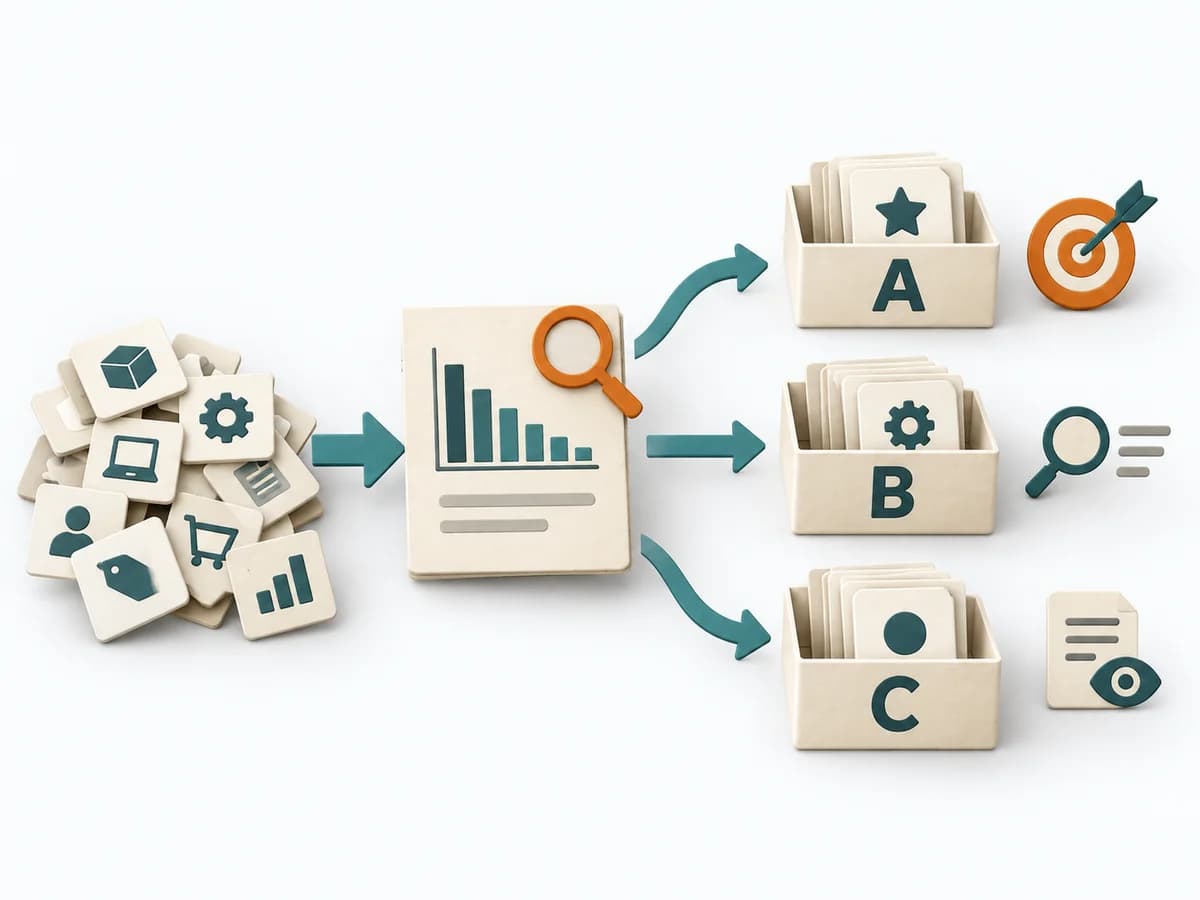 Operations ABC Analysis |  Operations Fishbone Diagram |
|---|---|---|---|
Purposedifferent | When delivery work dissolves into wait times, handoffs, and hidden effort, Value Stream Mapping makes the actual flow visible. The method exposes bottlenecks, idle time, and feedback loops so lead time and improvement levers become tangible. | With many similar objects of differing economic significance, the method prioritizes effort by effect. It separates what needs regular steering from what rarely needs attention. | When a problem has several possible contributing factors, the method sorts causes by cause areas. It prevents an initial hunch from blocking the view of other plausible drivers. |
Complexitydifferent | Medium | Low | Low |
Timedifferent | 1-3 h | 30-60 min | 30-60 min |
Participantsdifferent | 4-10 | 1-5 | 2-8 |
Formatdifferent | Workshop | Async | Workshop |
Outputdifferent | Current-state map, Future-state map, Bottleneck list | ABC Classification, Focus Rules, Control List | Fishbone Diagram, Cause Categories, Investigation Backlog |
Tagsno overlap | LeanFlowWasteDelivery | PrioritizationOperationsPortfolio | Root causeQualityOperations |
Often compared together
Methods with strong topical overlap with the current selection, not yet in the comparison.