View methods side by side.
Choose up to four methods. Add them using the search and share the comparison by copying its link.
| Criterion | 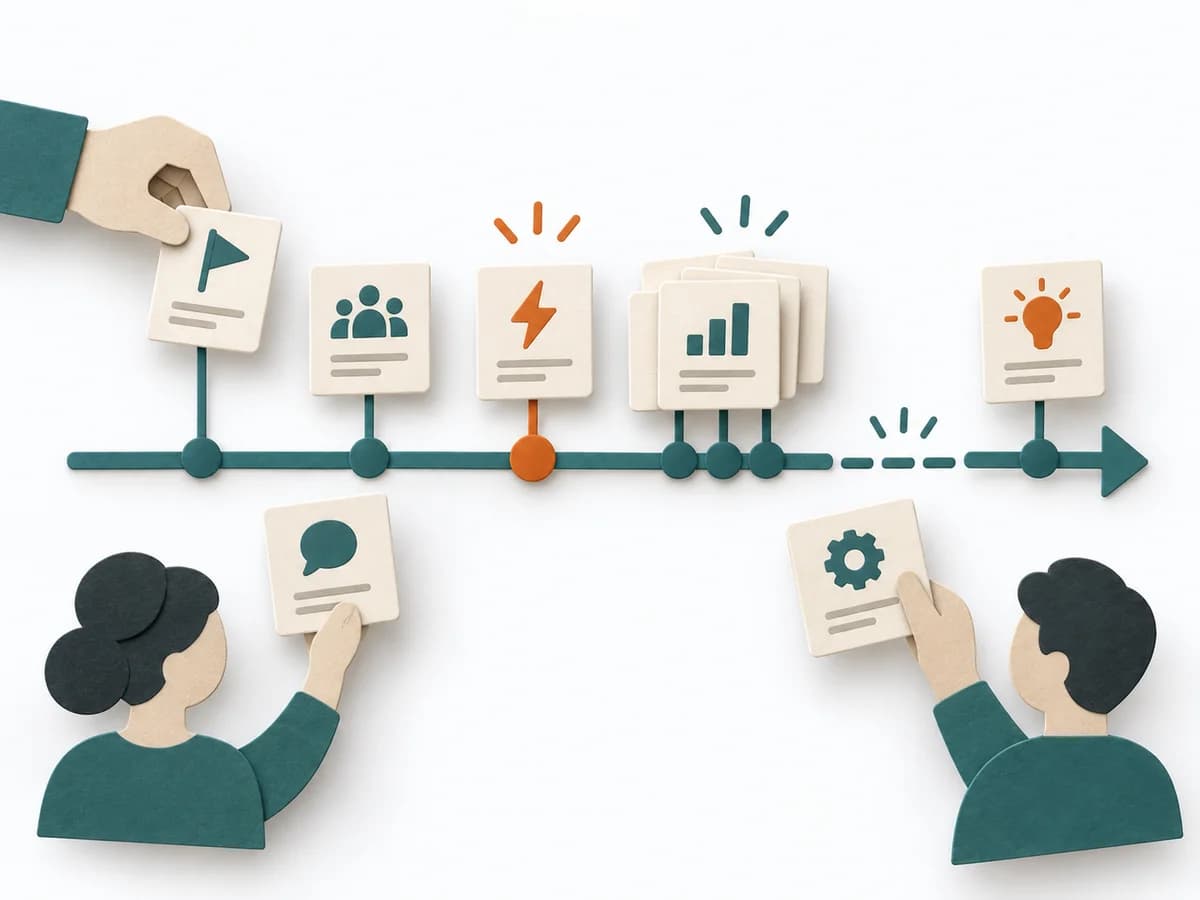 Facilitation Timeline | 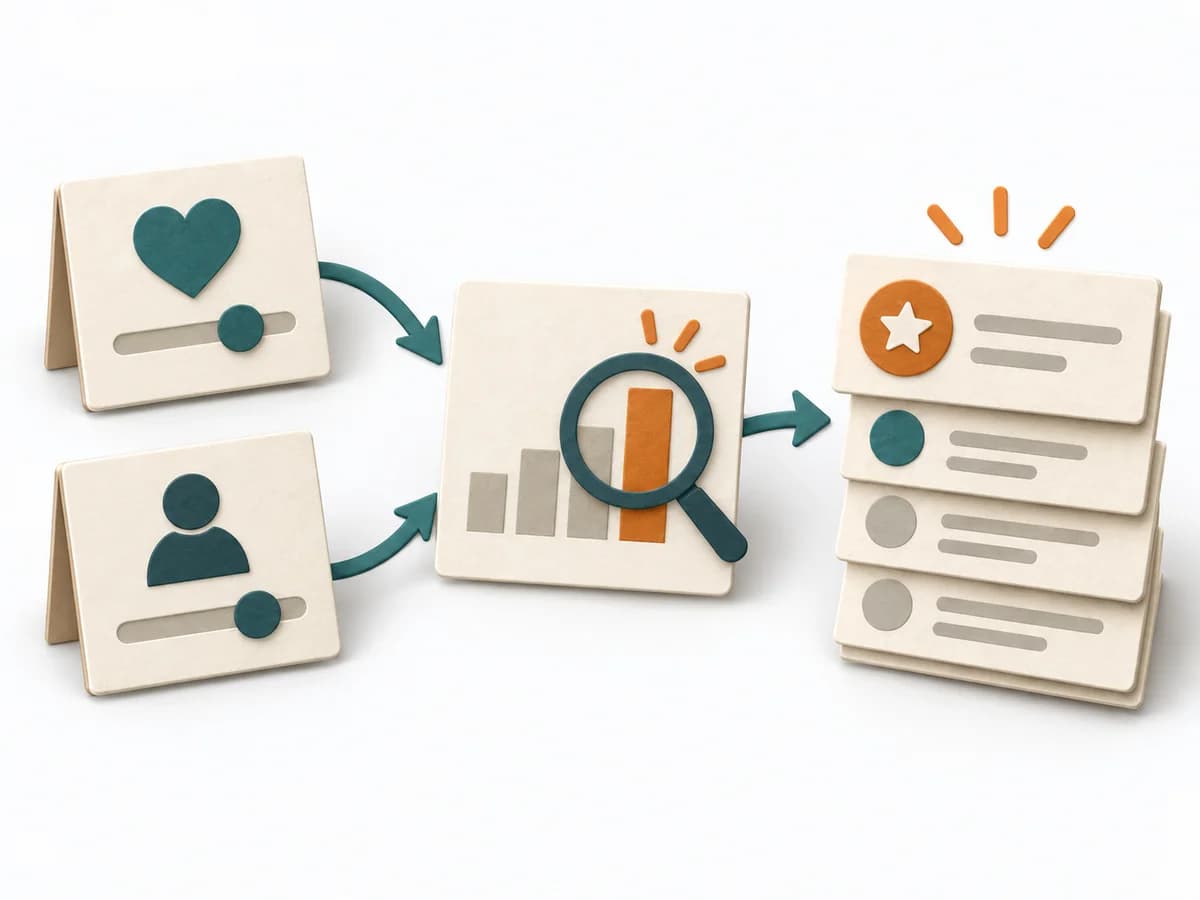 Product Discovery Opportunity Scoring | 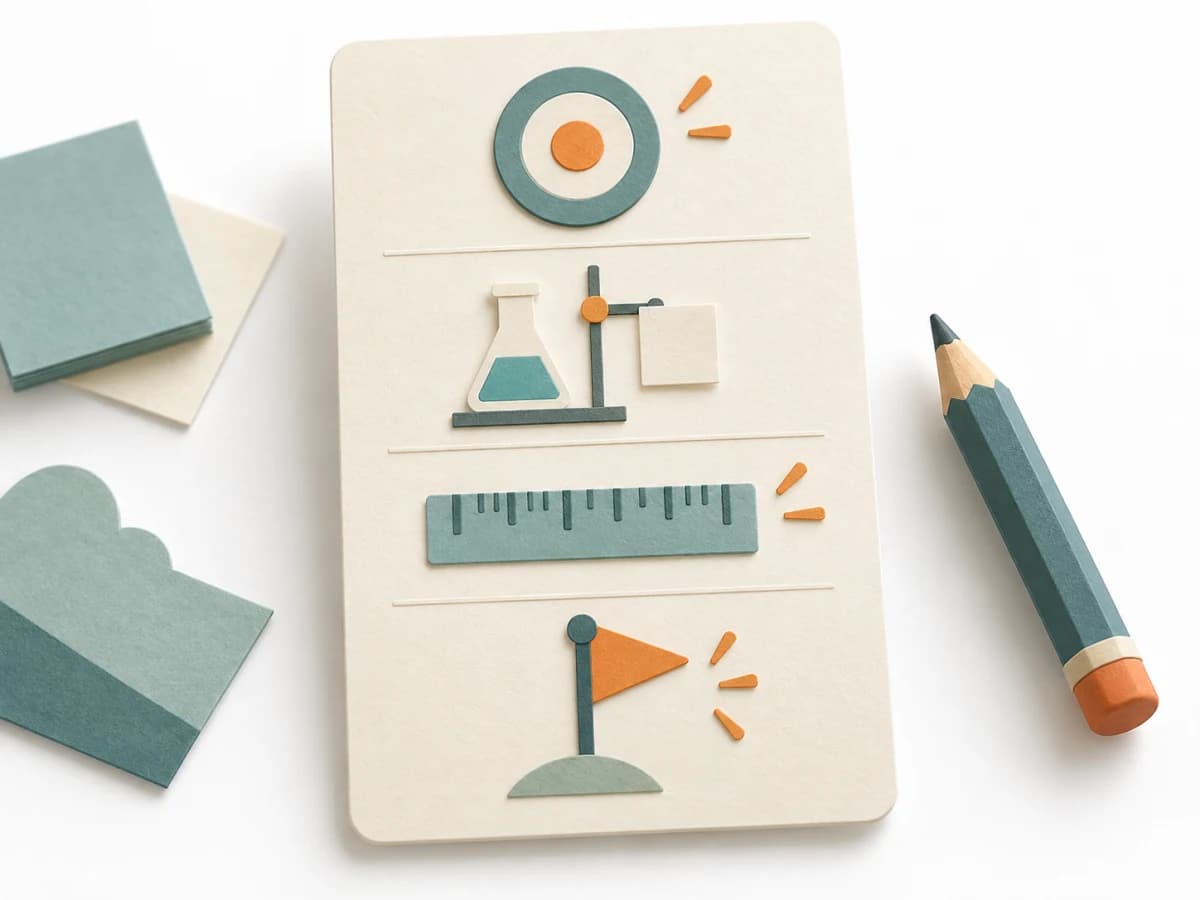 Product Discovery Test Card | 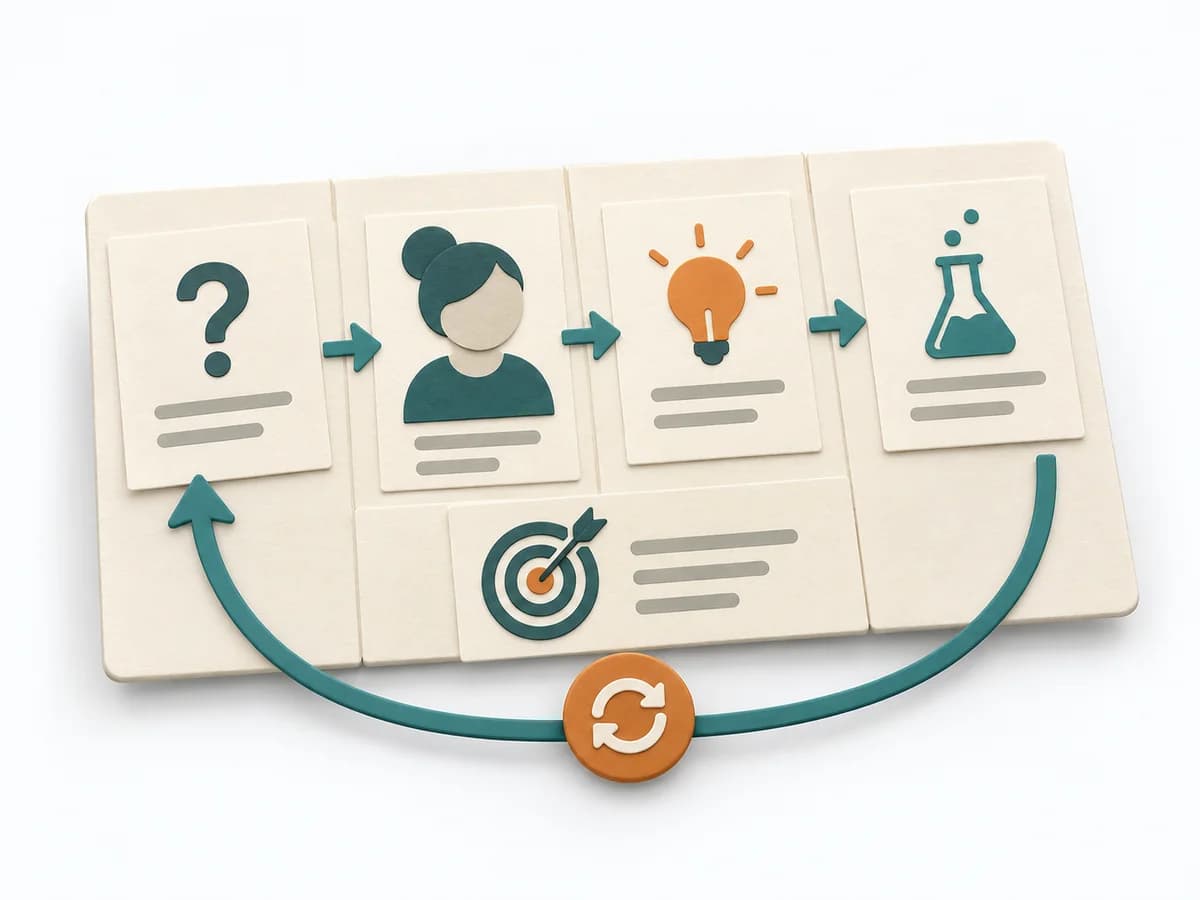 UX Design Lean UX Canvas |
|---|---|---|---|---|
Purposedifferent | When a project, incident, or change process is only remembered in fragments, Timeline brings the sequence back into a readable form. It makes turning points, precursors, and after-effects recognizable over the course of time. | When opportunities need ranking by their effect, it makes importance and satisfaction directly comparable. It separates problem, assumption, solution, and evidence. The result is captured as an opportunity-score table and top outcomes. | The Test Card turns a critical assumption into a testable claim and specifies in advance which result counts as success. | The Lean UX Canvas helps clarify user behavior, touchpoints, and concept decisions. It makes assumptions and desired outcomes visible and captures the result as a completed canvas, hypothesis list, and first experiment. |
Complexitydifferent | Low | Medium | Low | Medium |
Timedifferent | 30-90 min | 60-120 min | 20-35 min | 2-3 h |
Participantsdifferent | 2-12 | 3-6 | 1-5 | 3-8 |
Formatsame | Workshop + async | Workshop + async | Workshop + async | Workshop + async |
Outputdifferent | Timeline, Milestones, Insight Notes | Opportunity Score Table, Top Outcomes | Test Card with a pre-set threshold | Completed Lean UX Canvas, Hypothesis list, First experiment |
Tagsno overlap | TimelineFacilitationSequence | PrioritizationDiscoveryOutcomesNeeds | ExperimentsValidationDiscoveryHypothesis | CanvasHypothesisOutcomesDiscovery |