View methods side by side.
Choose up to four methods. Add them using the search and share the comparison by copying its link.
| Criterion | 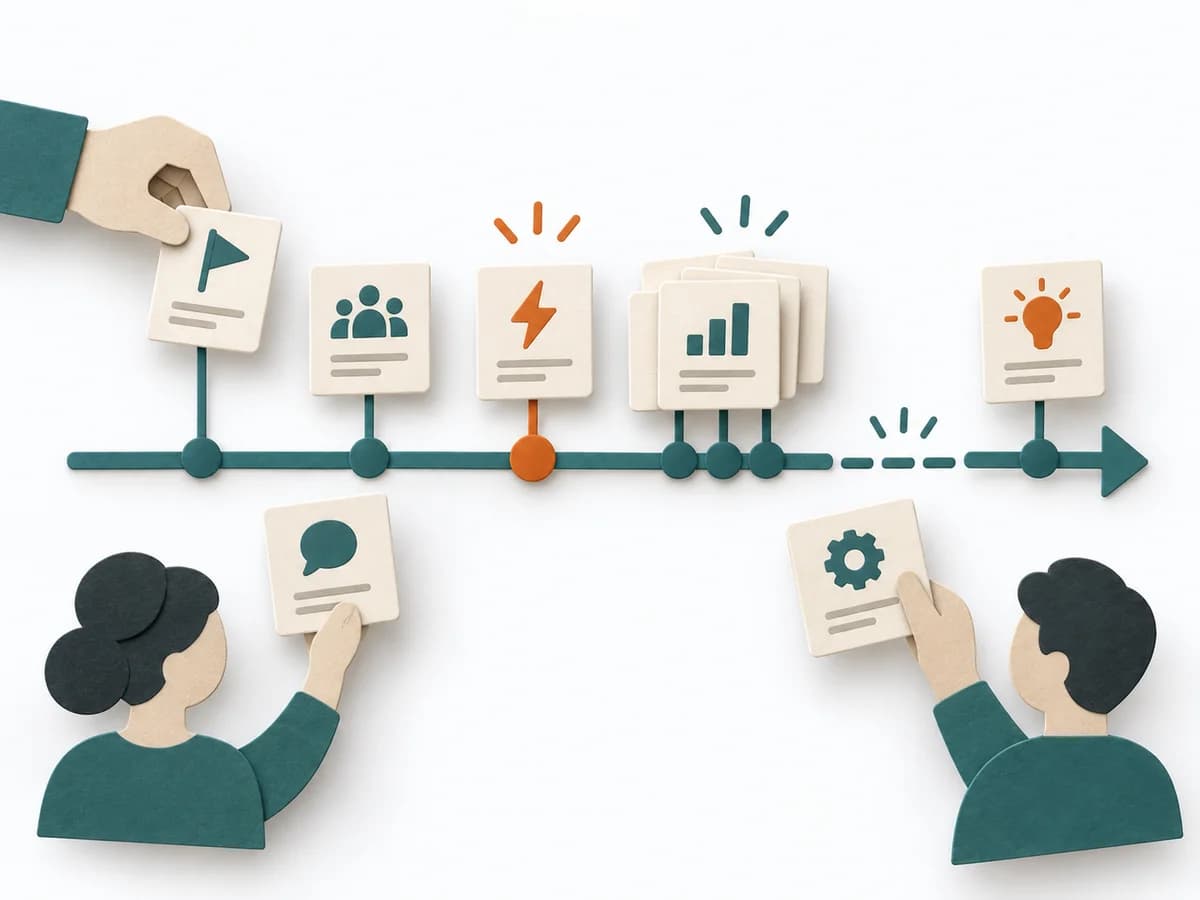 Facilitation Timeline | 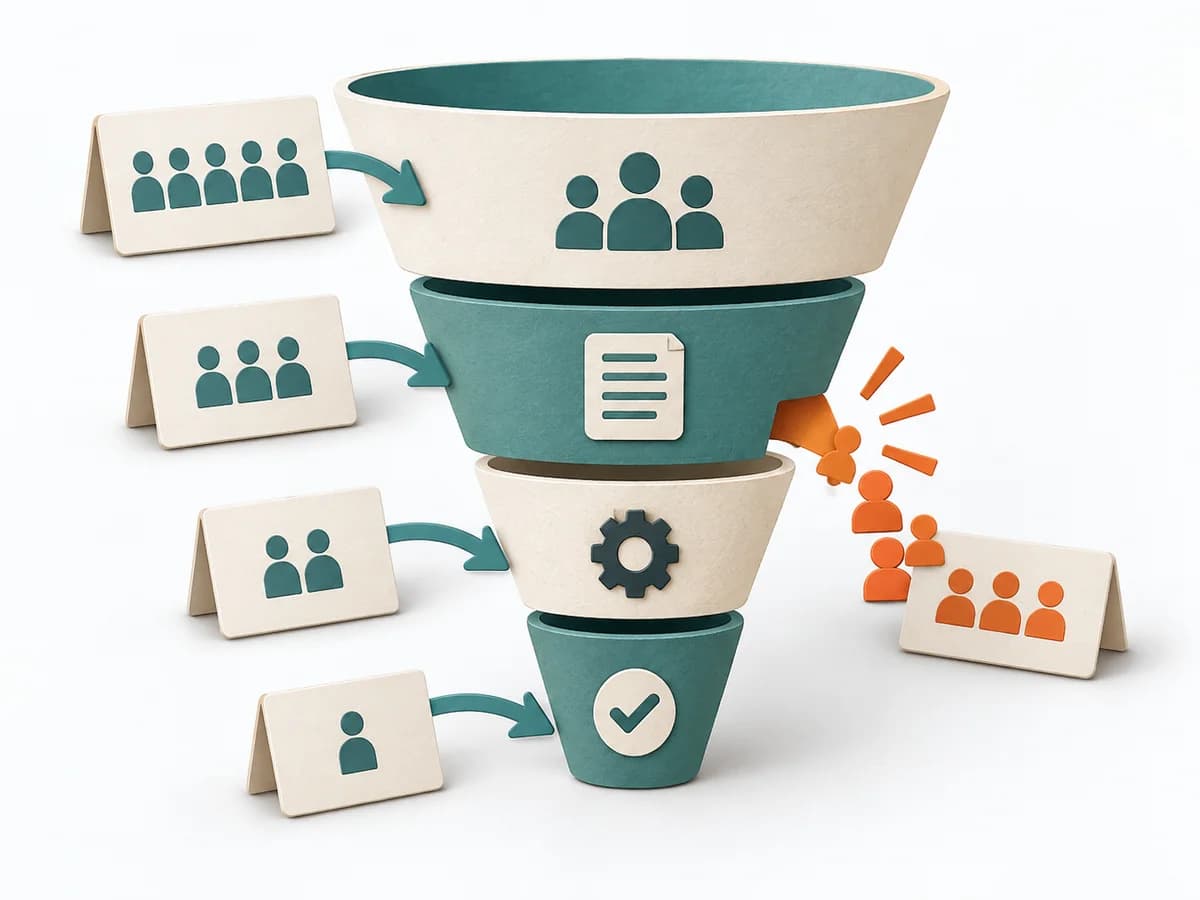 Growth Funnel Analysis | 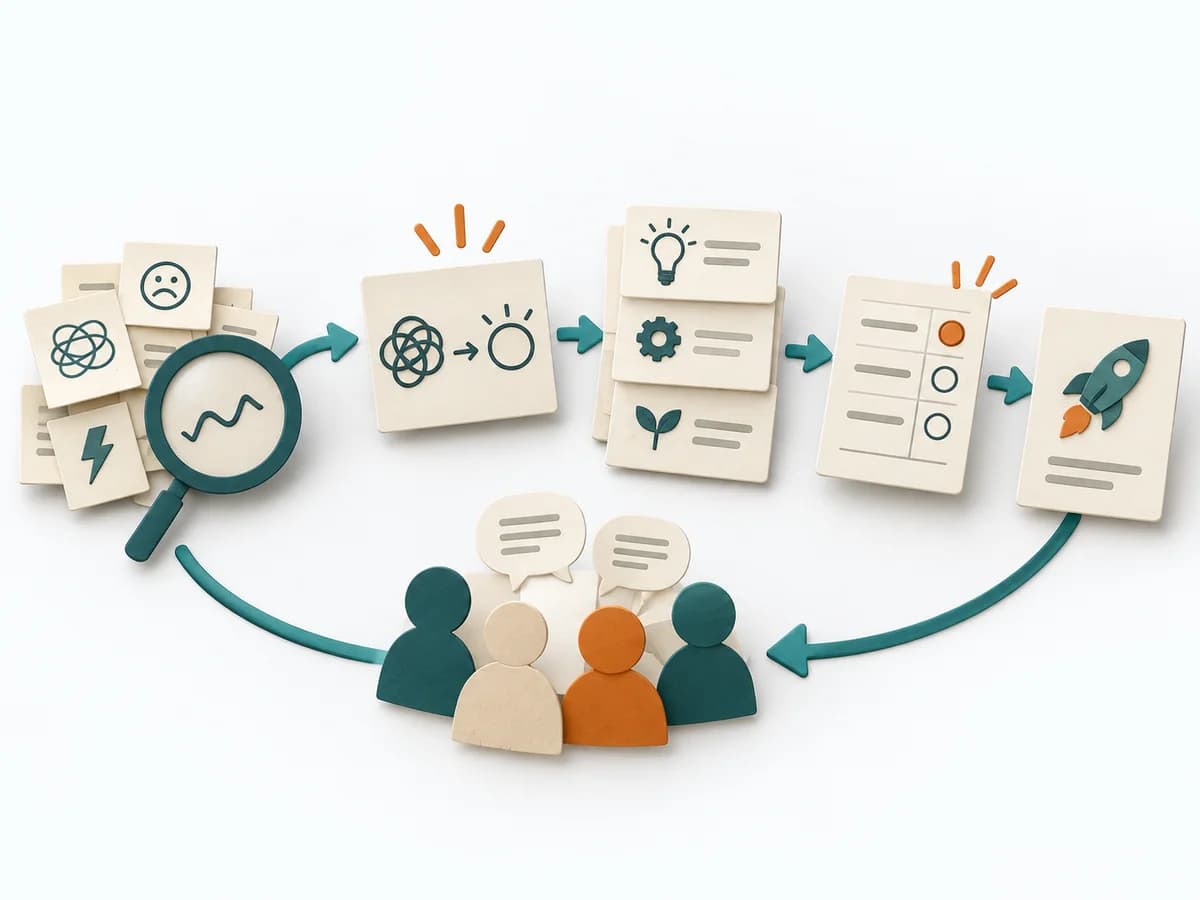 Facilitation Decision Jam |  Product Strategy ICE Scoring |
|---|---|---|---|---|
Purposedifferent | When a project, incident, or change process is only remembered in fragments, Timeline brings the sequence back into a readable form. It makes turning points, precursors, and after-effects recognizable over the course of time. | When many visitors or users drop off along the way, the reason behind the number often stays hidden. Funnel Analysis exposes these transitions and makes visible exactly where the path collapses. | When a decision is stuck, Decision Jam loosens the knot through structured separation of problem, idea, and selection. The format creates movement without jumping prematurely at the first seemingly elegant answer. | When ideas need sorting quickly, it condenses impact, confidence, and effort into one compact score. It connects customer value, product logic, and decision priorities. The result is captured as an ICE table and top-ideas list. |
Complexitydifferent | Low | Medium | Low | Low |
Timedifferent | 30-90 min | 1-3 h | 60-90 min | 30-60 min |
Participantsdifferent | 2-12 | 1-5 | 4-10 | 2-8 |
Formatdifferent | Workshop + async | Async | Workshop | Workshop + async |
Outputdifferent | Timeline, Milestones, Insight Notes | Funnel report, Drop-off analysis, Optimization hypotheses | Problem Cluster, Prioritized Challenge, Experiment | ICE Table, Top Idea List |
Tagsno overlap | TimelineFacilitationSequence | AnalyticsConversionGrowth | FacilitationDecisionProblem solvingWorkshop | PrioritizationScoringGrowthDecision |