View methods side by side.
Choose up to four methods. Add them using the search and share the comparison by copying its link.
| Criterion | 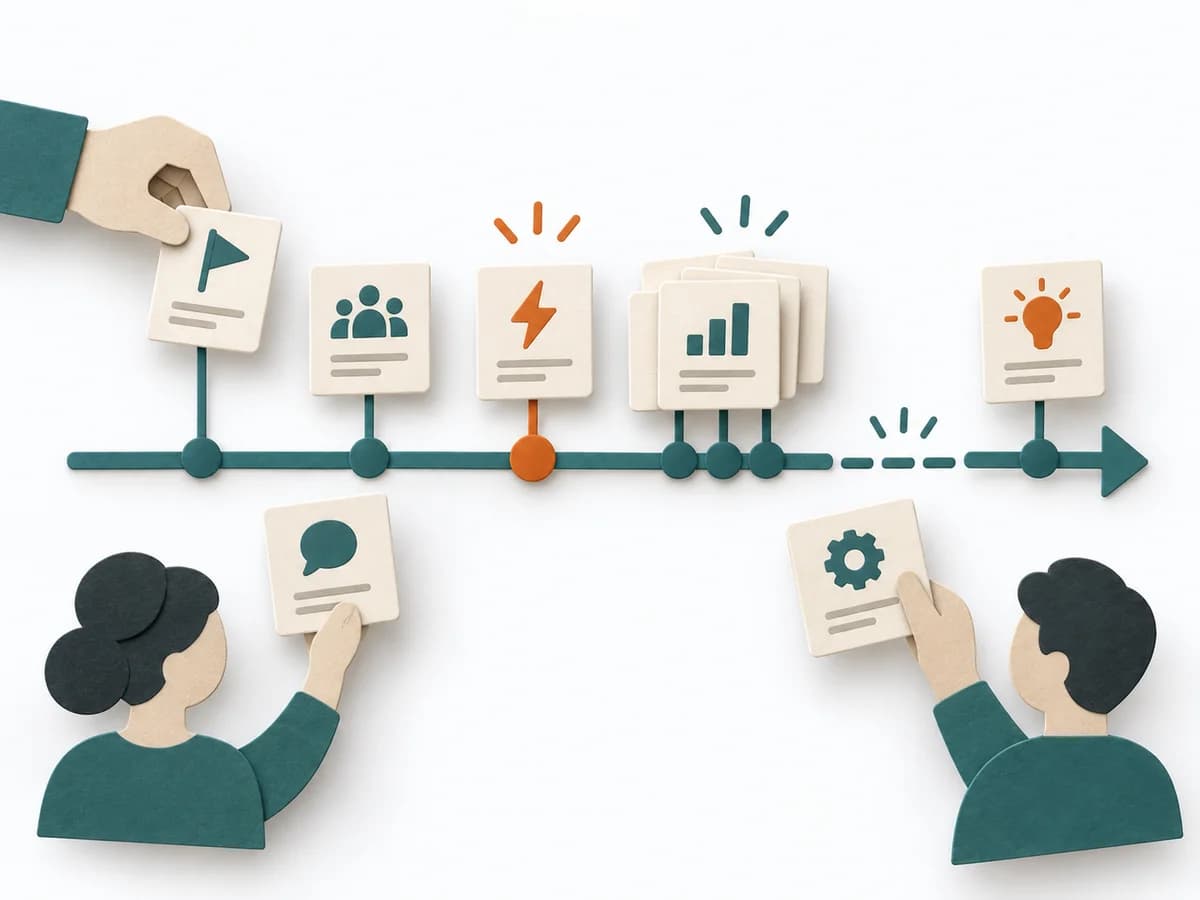 Facilitation Timeline |  UX Research Empathy Mapping | 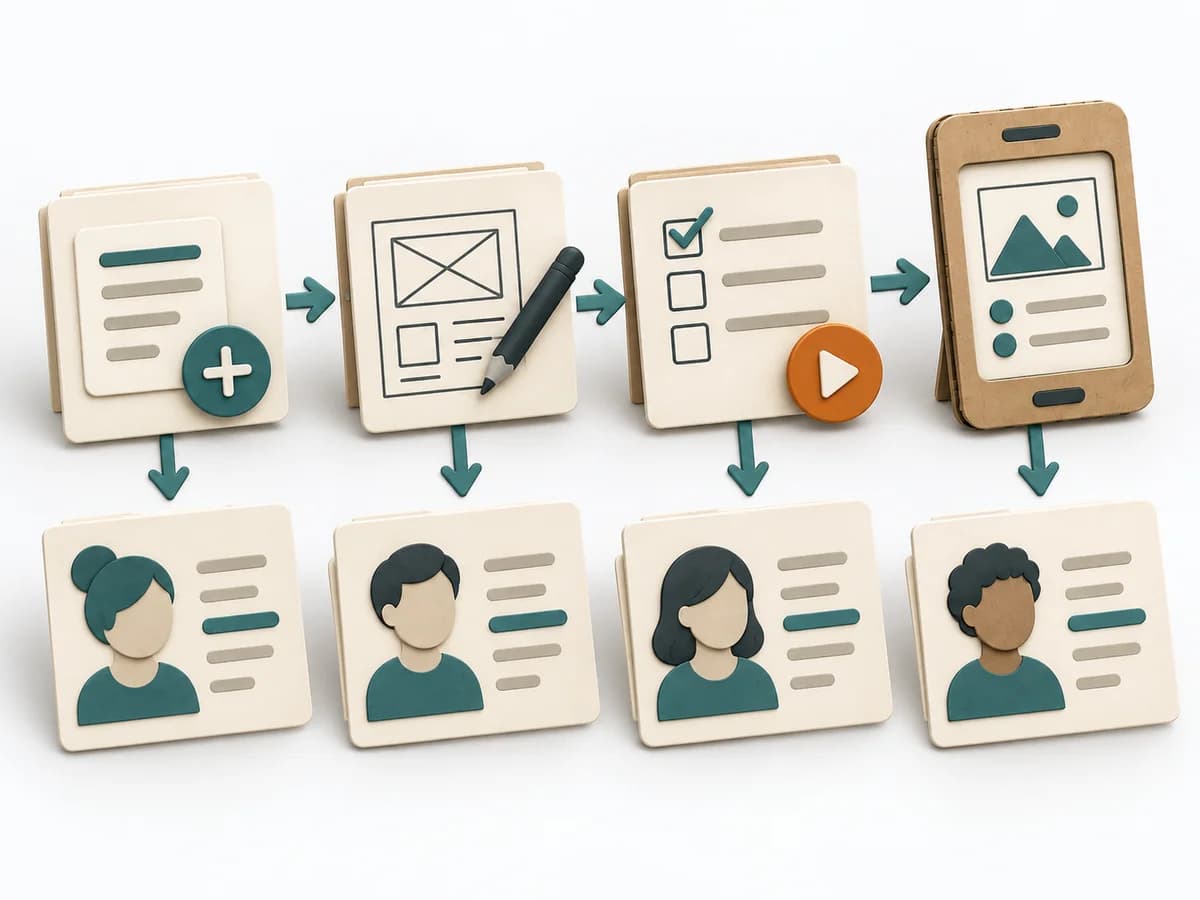 Knowledge Modeling Event Modeling | 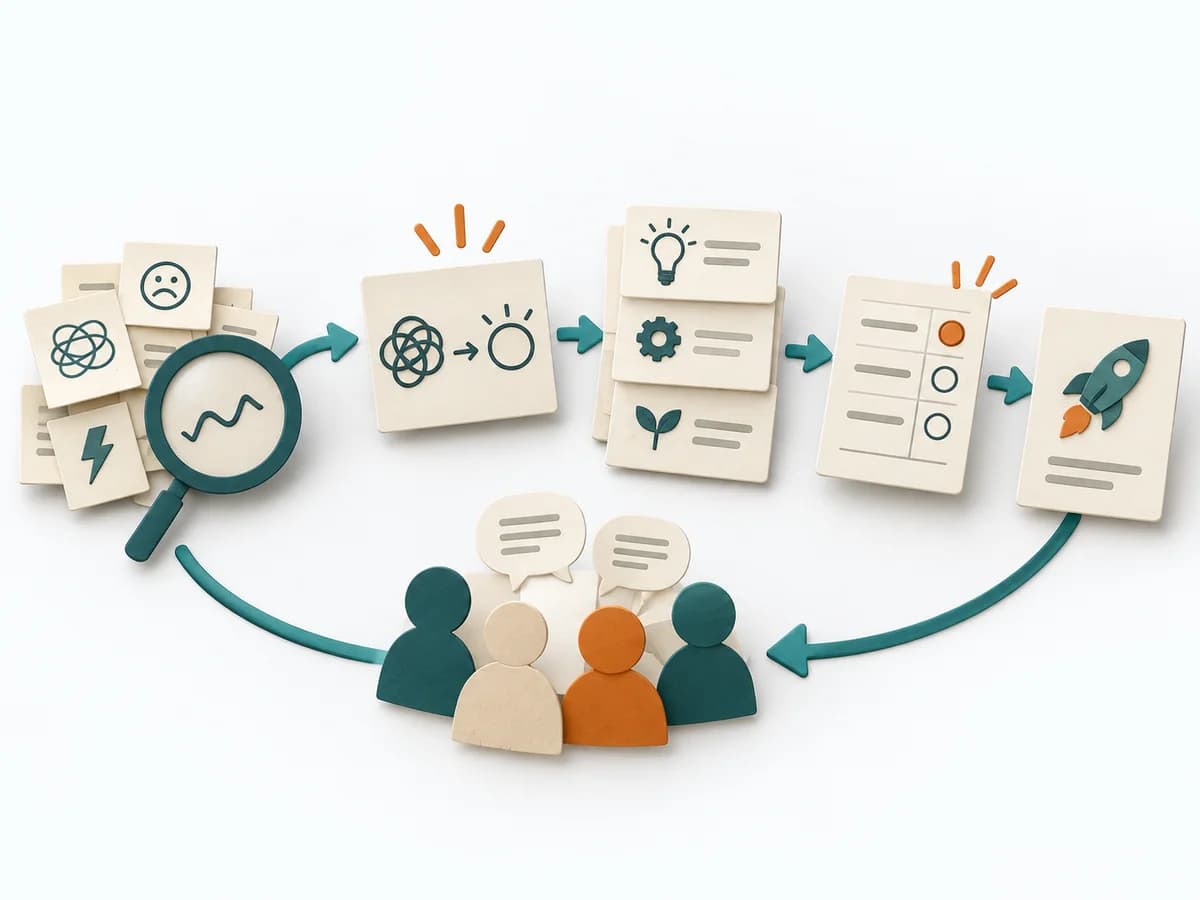 Facilitation Decision Jam |
|---|---|---|---|---|
Purposedifferent | When a project, incident, or change process is only remembered in fragments, Timeline brings the sequence back into a readable form. It makes turning points, precursors, and after-effects recognizable over the course of time. | When a lot is assumed about a target group but little is seen jointly, empathy mapping makes knowledge and gaps directly comparable. The picture also shows which assumptions hold up and where evidence is missing. | Event Modeling connects business workflows with commands, events, and views into one coherent mental model. It helps design behavior, UI, and technical slices from the same underlying logic. | When a decision is stuck, Decision Jam loosens the knot through structured separation of problem, idea, and selection. The format creates movement without jumping prematurely at the first seemingly elegant answer. |
Complexitydifferent | Low | Low | Medium | Low |
Timedifferent | 30-90 min | 30–60 min | 2-6 h | 60-90 min |
Participantsdifferent | 2-12 | 4-8 | 2-8 | 4-10 |
Formatdifferent | Workshop + async | Workshop | Workshop + async | Workshop |
Outputdifferent | Timeline, Milestones, Insight Notes | Empathy Map, Assumptions List, Research Gaps | Event Model, UI Flow, Commands, Read Models | Problem Cluster, Prioritized Challenge, Experiment |
Tagsno overlap | TimelineFacilitationSequence | SynthesisQualitativeWorkshop | EventsBlueprintDomain-Driven DesignBehavior | FacilitationDecisionProblem solvingWorkshop |