View methods side by side.
Choose up to four methods. Add them using the search and share the comparison by copying its link.
| Criterion | 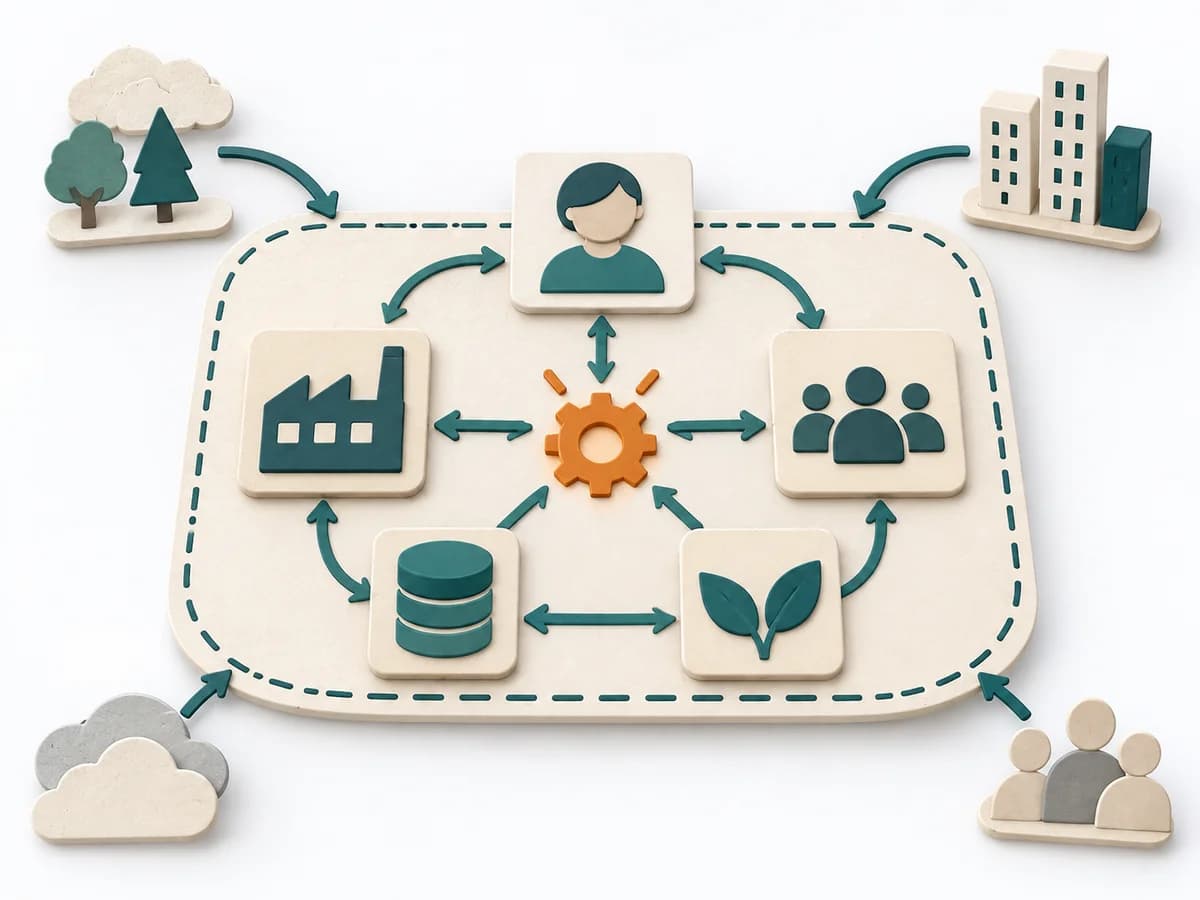 Systems Thinking Systems Mapping |  Product Strategy ICE Scoring | 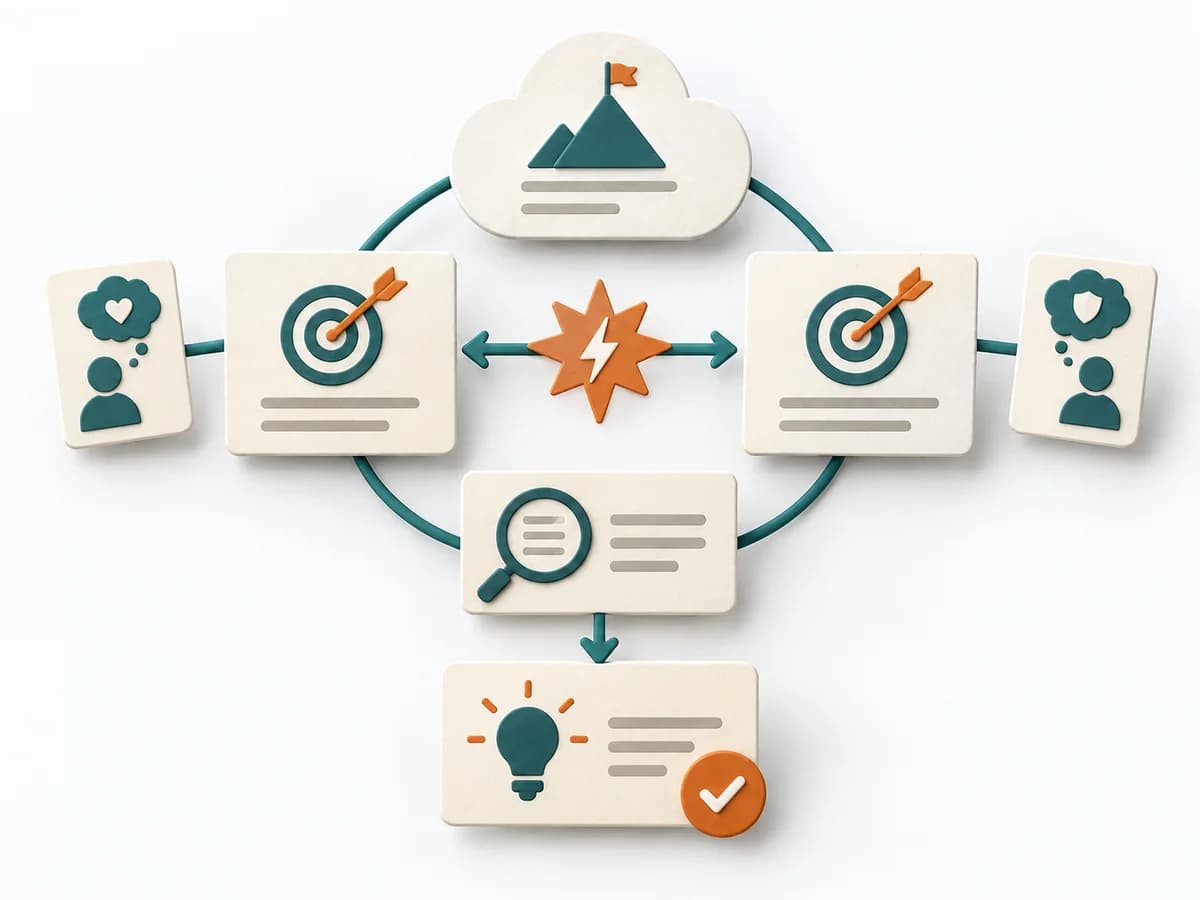 Systems Thinking Evaporating Cloud |  Delivery Cost of Delay |
|---|---|---|---|---|
Purposedifferent | Systems Mapping arranges elements, relationships, and boundaries so a complex field becomes legible at a glance. The overview stabilizes the overall picture before detail work or steering begins. | When ideas need sorting quickly, it condenses impact, confidence, and effort into one compact score. It connects customer value, product logic, and decision priorities. The result is captured as an ICE table and top-ideas list. | The method makes visible why two seemingly incompatible demands arise and which assumption must be tested to resolve the conflict. | Helps clarify scope, order, and delivery flow in concrete terms. It makes work, constraints, and sequence manageable. The result is captured as a Cost of Delay table and prioritization sequence. |
Complexitydifferent | Medium | Low | Medium | High |
Timedifferent | 1-3 h | 30-60 min | 60-120 min | 90-180 min |
Participantsdifferent | 3-12 | 2-8 | 2-8 | 3-8 |
Formatdifferent | Workshop + async | Workshop + async | Workshop | Workshop |
Outputdifferent | System Map, Dependencies, Leverage Points | ICE Table, Top Idea List | Conflict Cloud, Assumption List, Breakthrough Ideas, Next Experiments | CoD Table, Prioritization Sequence |
Tagsno overlap | Systems thinkingMappingBoundariesChange | PrioritizationScoringGrowthDecision | Theory of ConstraintsAssumptionsSystems thinking | PrioritizationDeliveryEconomicsDecision |