View methods side by side.
Choose up to four methods. Add them using the search and share the comparison by copying its link.
| Criterion |  UX Research Surveys | 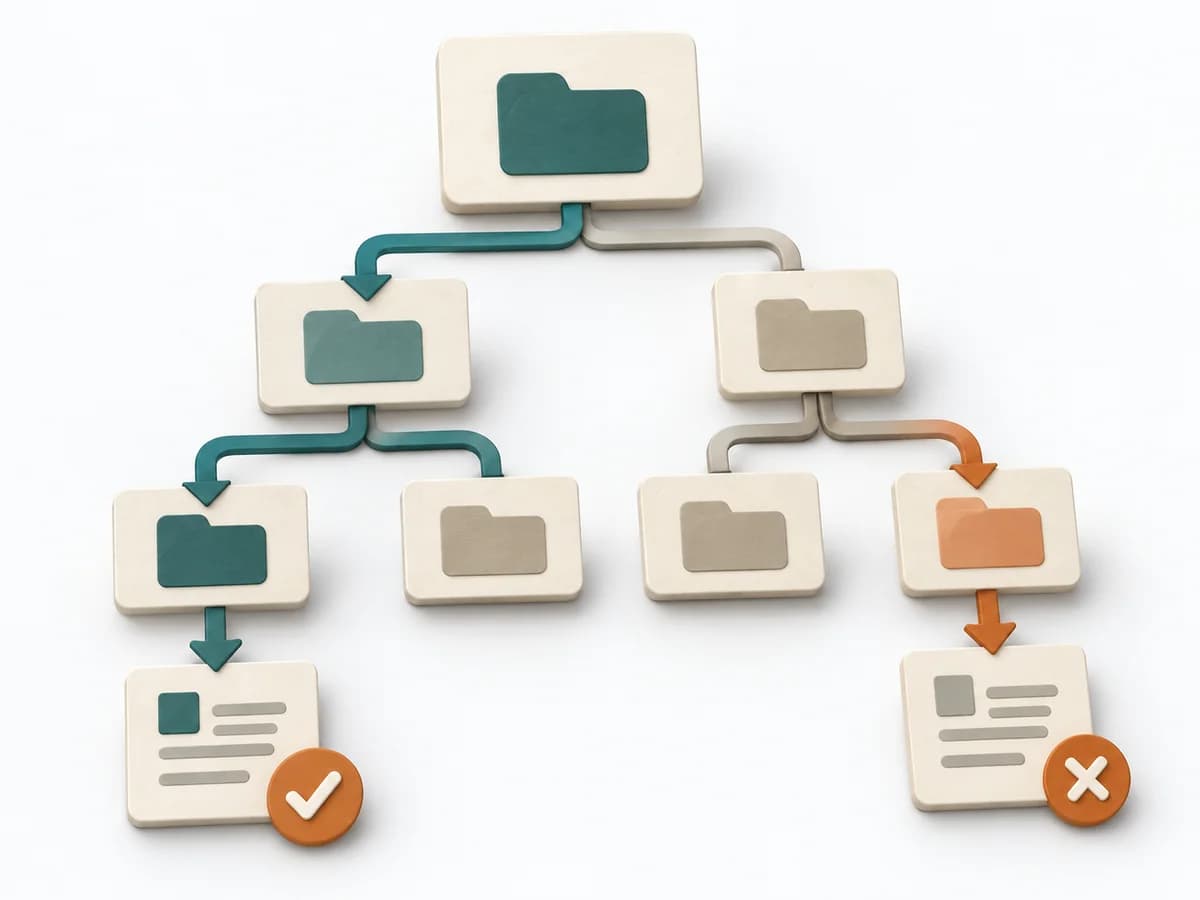 UX Research Tree Testing |  UX Research Empathy Mapping |
|---|---|---|---|
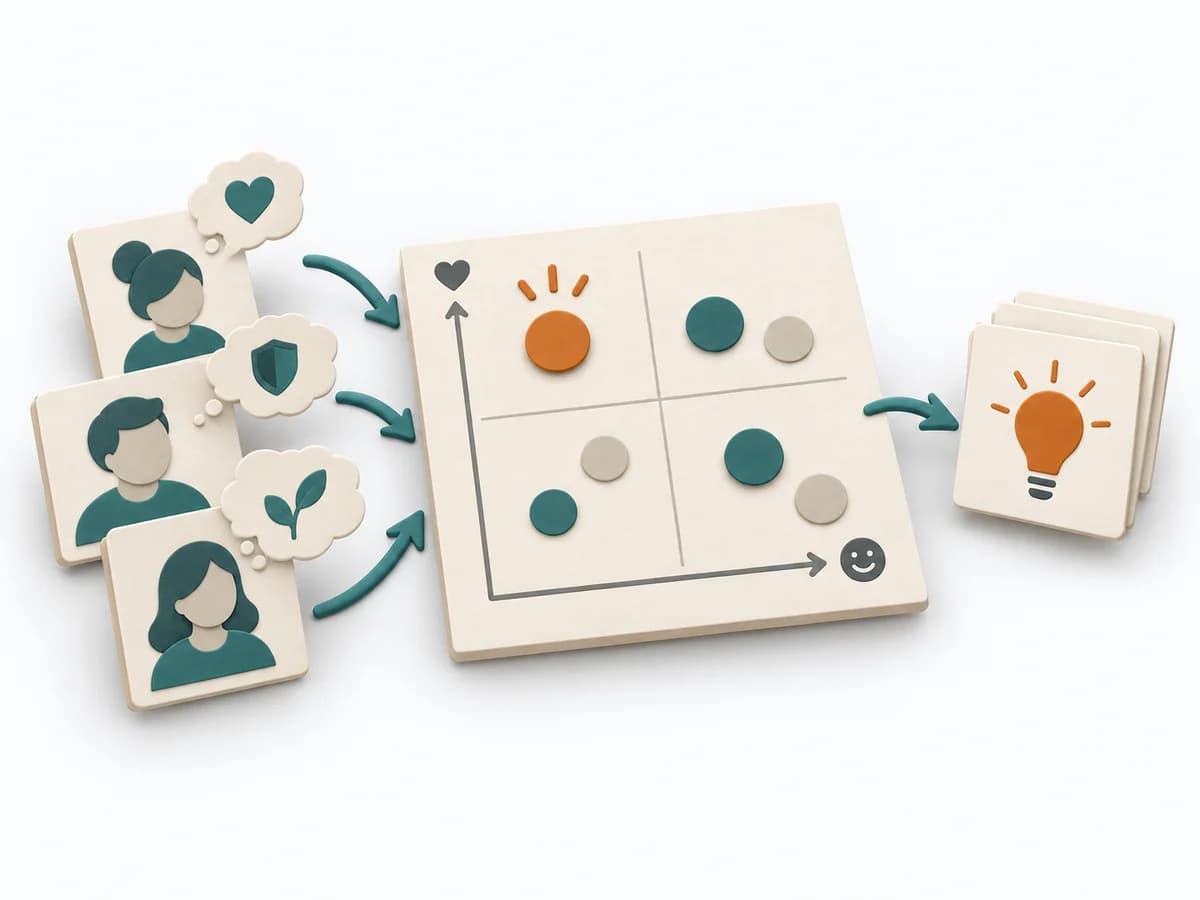
Purposedifferent | When a topic needs to be validated broadly and many people can answer the same question, surveys gather structured feedback in a scalable form. Answers become comparable and segmentable instead of remaining merely anecdotal. | When a navigation exists but search paths still fail, tree testing checks findability without visual distraction. The method shows whether labels, levels, and paths really lead to the intended destination. | When a lot is assumed about a target group but little is seen jointly, empathy mapping makes knowledge and gaps directly comparable. The picture also shows which assumptions hold up and where evidence is missing. |
Complexitydifferent | Medium | Medium | Low |
Timedifferent | 3-14 Tage | 1-2 Tage | 30–60 min |
Participantsdifferent | 50+ | Based on research question | 4-8 |
Formatdifferent | Async | Async | Workshop |
Outputdifferent | Survey Results, Charts, Segment Insights | Findability Metrics, Path Analysis, Revised IA | Empathy Map, Assumptions List, Research Gaps |
Tagsno overlap | QuantitativeResearchValidation | Information architectureNavigationFindability | SynthesisQualitativeWorkshop |
Often compared together
Methods with strong topical overlap with the current selection, not yet in the comparison.