View methods side by side.
Choose up to four methods. Add them using the search and share the comparison by copying its link.
| Criterion |  UX Research Surveys |  Product Strategy Lean Canvas | 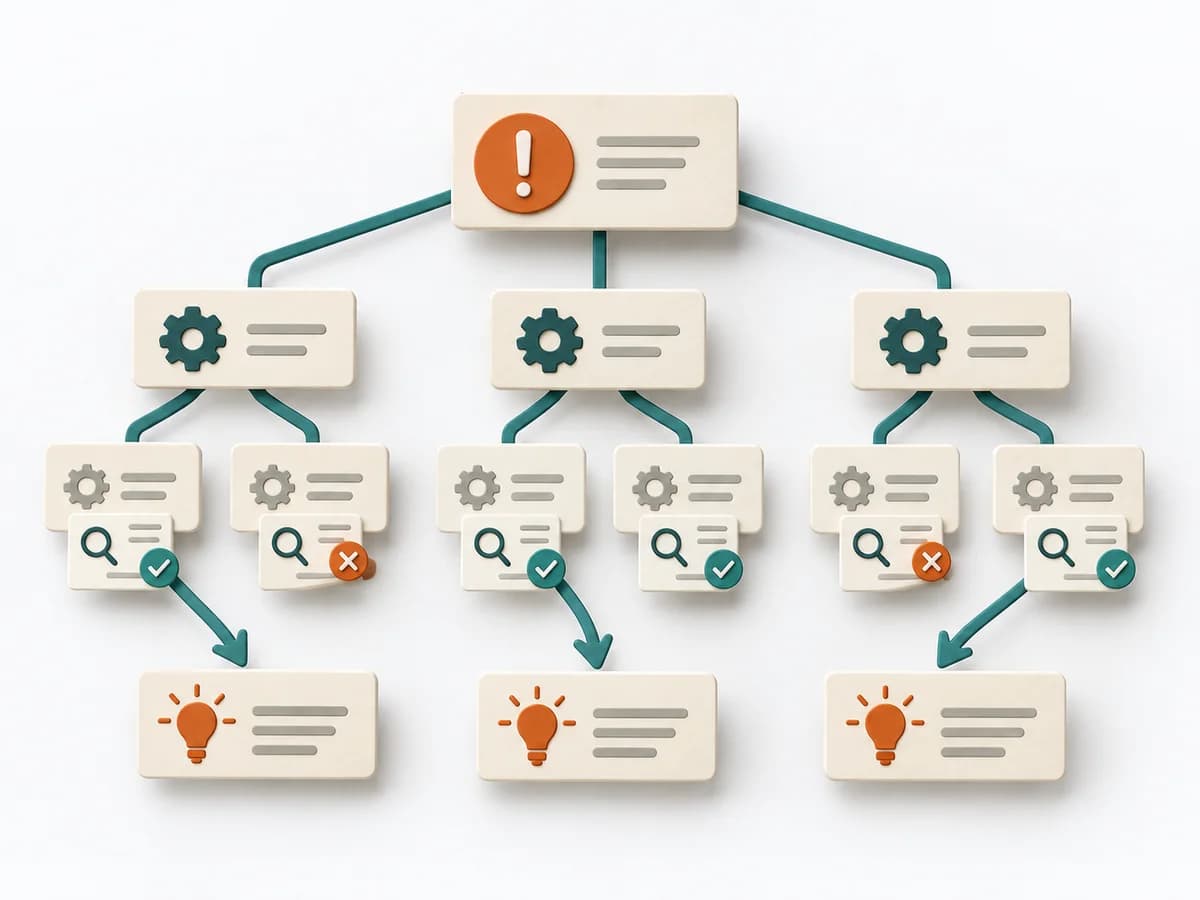 Operations Root Cause Tree Analysis |  Innovation Lean Startup |
|---|---|---|---|---|
Purposedifferent | When a topic needs to be validated broadly and many people can answer the same question, surveys gather structured feedback in a scalable form. Answers become comparable and segmentable instead of remaining merely anecdotal. | When an early product bet still has too many open points, it brings target group, problem, and assumptions into a single view. It condenses the idea so core risks become nameable. | For a problem with several suspected causes, the method builds a causal structure instead of a mere list. It makes visible how causes connect and where the strongest points of leverage lie. | For uncertain business assumptions, the method forces the idea into contact with real market reactions early. It separates wishful picture, assumption, and observable behavior, so that learning becomes faster than planning. This translates uncertainty into measurable insight. |
Complexitysame | Medium | Medium | Medium | Medium |
Timedifferent | 3-14 Tage | 45-90 min | 1-3 h | Wochen bis Monate je Lernzyklus |
Participantsdifferent | 50+ | 1-6 | 2-8 | 2-8 |
Formatdifferent | Async | Workshop + async | Workshop | Workshop + async |
Outputdifferent | Survey Results, Charts, Segment Insights | Lean Canvas, Core Assumptions, Experiment Backlog | Cause Tree, Evidence Notes, Countermeasures | Hypothesis list, MVPs, Learning reports, Pivot or persevere decision |
Tagsno overlap | QuantitativeResearchValidation | StartupLeanAssumptionsBusiness model | Root causeTreeIncidentQuality | LeanStartupValidationMVP |