View methods side by side.
Choose up to four methods. Add them using the search and share the comparison by copying its link.
| Criterion |  UX Research Surveys | 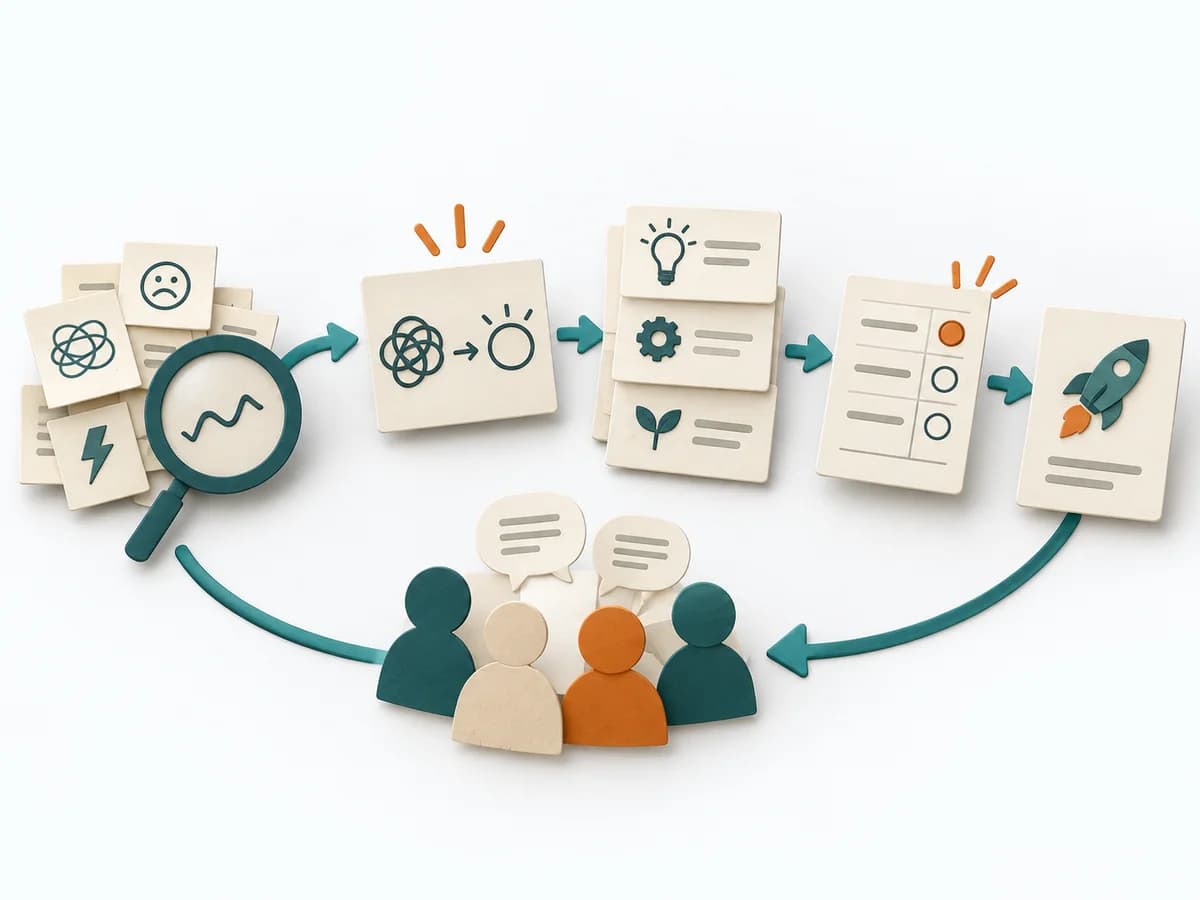 Facilitation Decision Jam |  Product Strategy ICE Scoring |  Delivery Cost of Delay |
|---|---|---|---|---|
Purposedifferent | When a topic needs to be validated broadly and many people can answer the same question, surveys gather structured feedback in a scalable form. Answers become comparable and segmentable instead of remaining merely anecdotal. | When a decision is stuck, Decision Jam loosens the knot through structured separation of problem, idea, and selection. The format creates movement without jumping prematurely at the first seemingly elegant answer. | When ideas need sorting quickly, it condenses impact, confidence, and effort into one compact score. It connects customer value, product logic, and decision priorities. The result is captured as an ICE table and top-ideas list. | Helps clarify scope, order, and delivery flow in concrete terms. It makes work, constraints, and sequence manageable. The result is captured as a Cost of Delay table and prioritization sequence. |
Complexitydifferent | Medium | Low | Low | High |
Timedifferent | 3-14 Tage | 60-90 min | 30-60 min | 90-180 min |
Participantsdifferent | 50+ | 4-10 | 2-8 | 3-8 |
Formatdifferent | Async | Workshop | Workshop + async | Workshop |
Outputdifferent | Survey Results, Charts, Segment Insights | Problem Cluster, Prioritized Challenge, Experiment | ICE Table, Top Idea List | CoD Table, Prioritization Sequence |
Tagsno overlap | QuantitativeResearchValidation | FacilitationDecisionProblem solvingWorkshop | PrioritizationScoringGrowthDecision | PrioritizationDeliveryEconomicsDecision |