View methods side by side.
Choose up to four methods. Add them using the search and share the comparison by copying its link.
| Criterion | 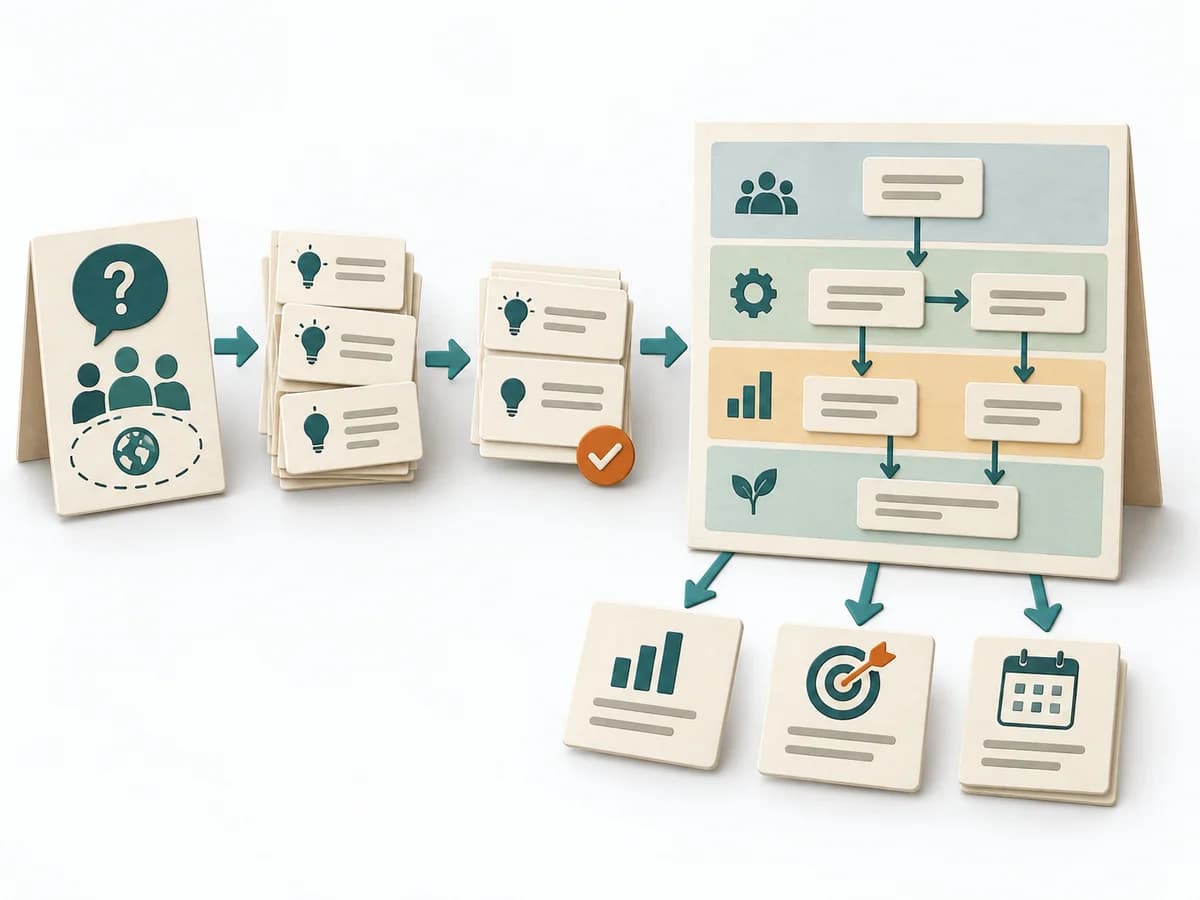 Business Strategy Strategy Map |  Operations Process Mapping | 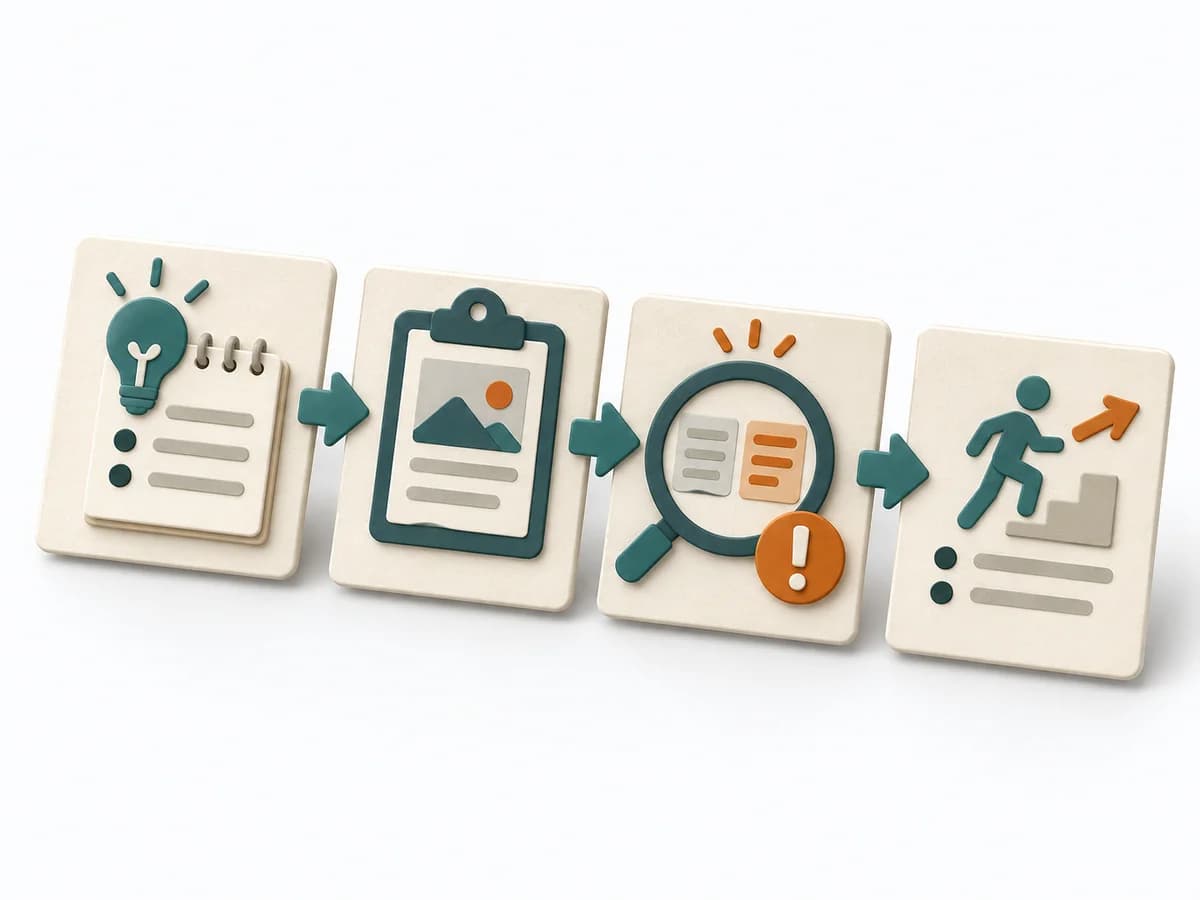 Operations After-Action Review | 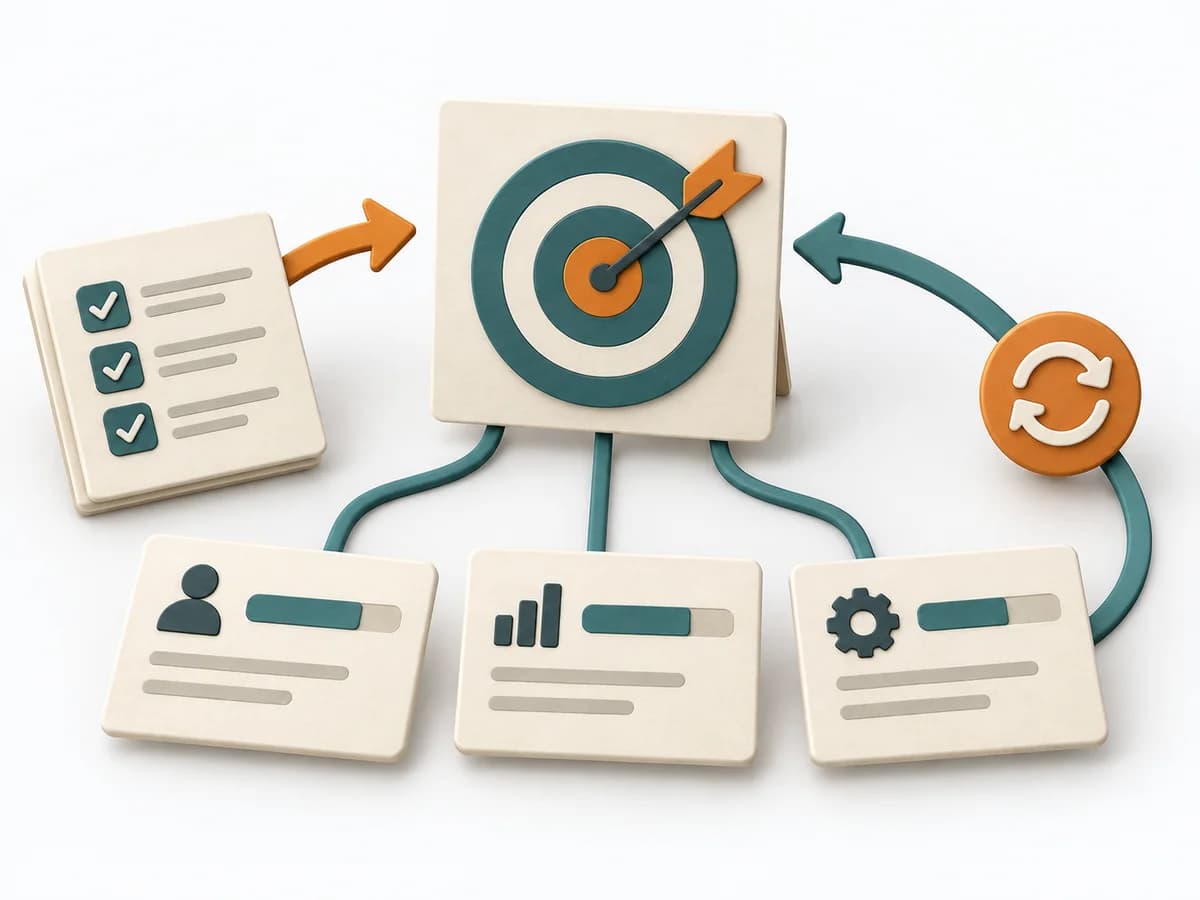 Product Strategy OKRs |
|---|---|---|---|---|
Purposedifferent | A Strategy Map translates strategy into a few connected objectives across perspectives such as finance, customers, processes, and learning. This makes visible which capabilities and activities are meant to drive which results. | With a confusing workflow that has many handoffs, the method makes the actual process visible. It shows where work is passed on, delayed, or duplicated, so improvement targets the right spots. | After missions or project phases with unclear outcomes, the method makes visible what actually happened and what can be learned from it. It separates course, effect, and causes so experience turns into solid improvement. | When strategic direction needs to become measurable, it connects ambition with checkable results. It makes goals connectable to focus and review. |
Complexitydifferent | Medium | Medium | Low | Medium |
Timedifferent | 2-4 h workshop plus review | 1-3 h | 20-45 min | 1-2 h Setup |
Participantsdifferent | 4-10 | 3-10 | 3-12 | 2-20 |
Formatdifferent | Workshop | Workshop | Workshop + async | Workshop + async |
Outputdifferent | Strategy Map, Objective Set, Cause-Effect Hypotheses | Process Map, Handoff List, Improvement Backlog | Lessons learned, Action items, Event summary | OKR set, Measurement plan, Review cadence |
Tagsno overlap | AlignmentExecutionGoalsCausality | ProcessOperationsImprovement | LearningOperationsImprovement | GoalsAlignmentOutcomesMeasurement |