View methods side by side.
Choose up to four methods. Add them using the search and share the comparison by copying its link.
| Criterion | 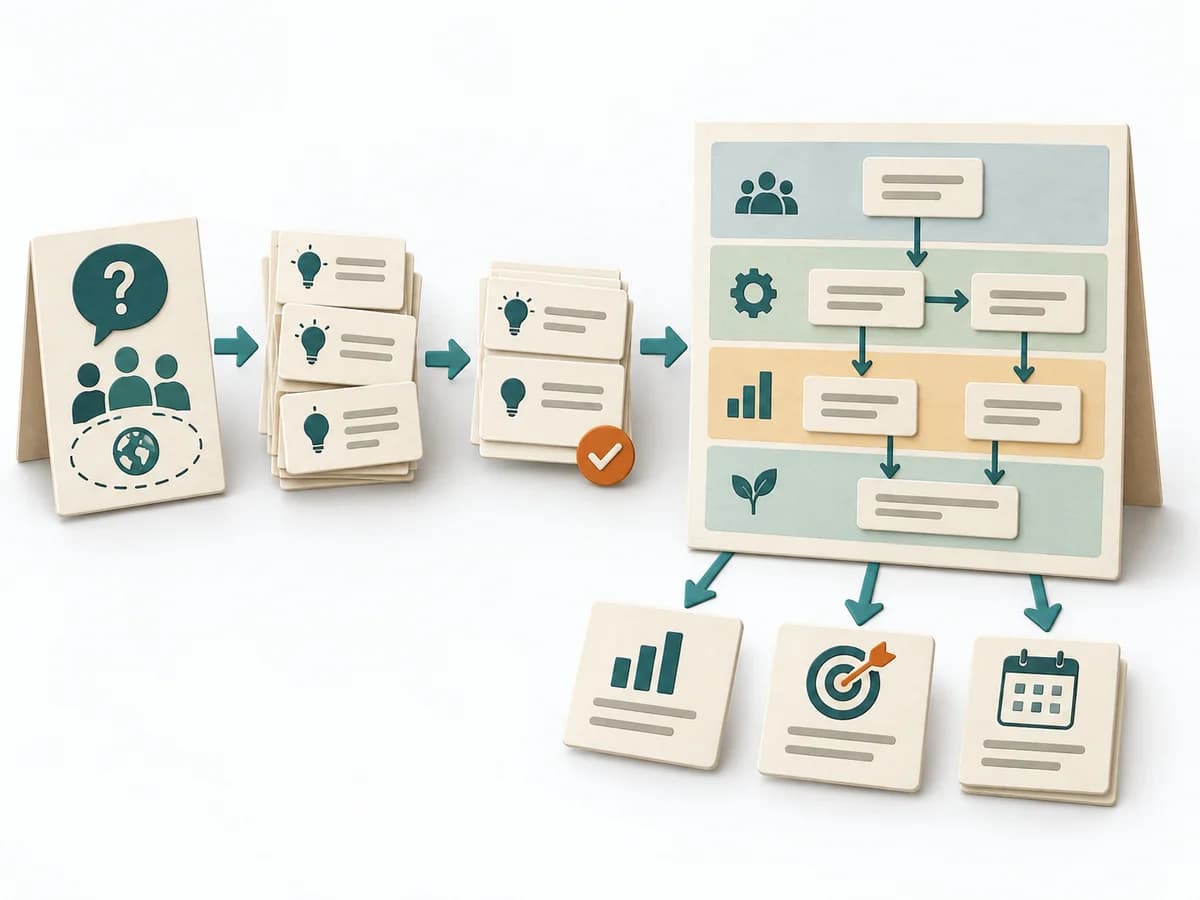 Business Strategy Strategy Map | 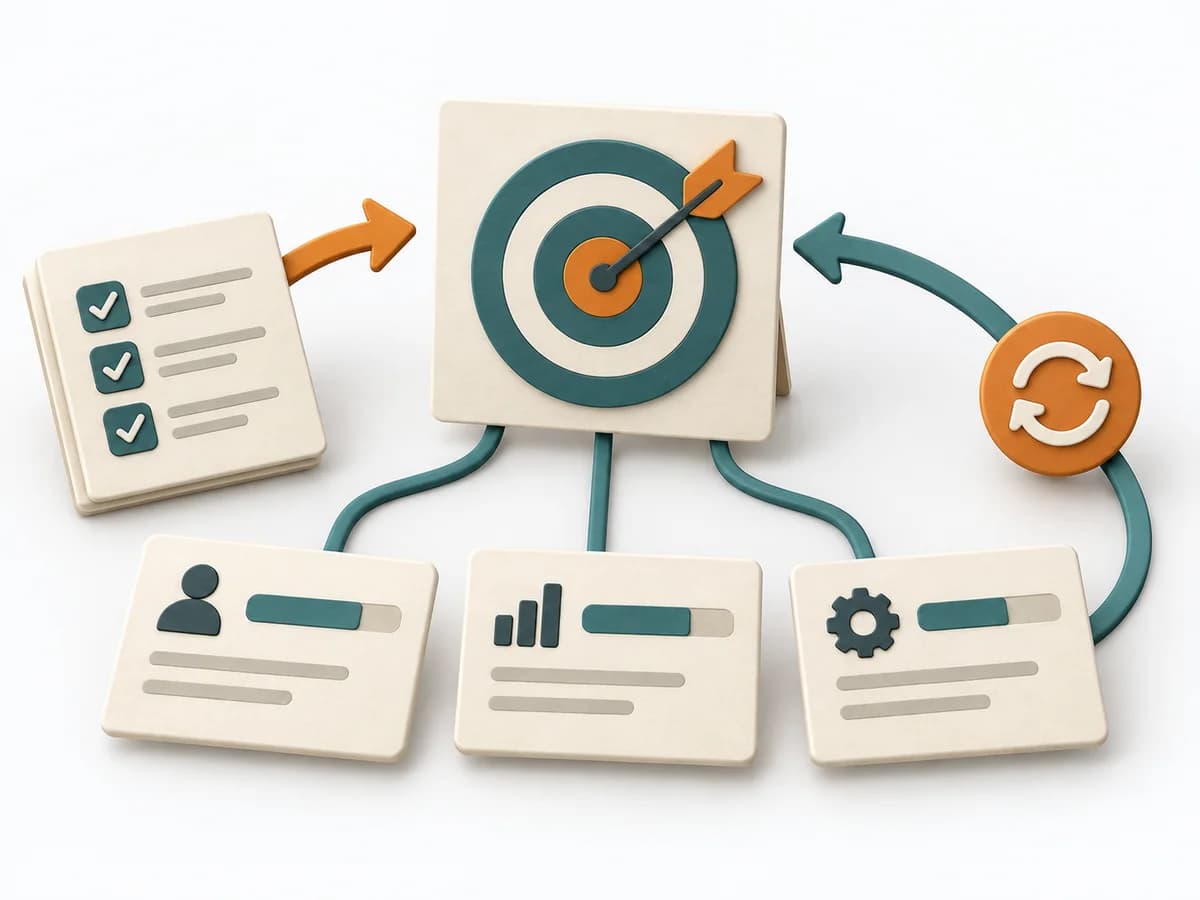 Product Strategy OKRs | 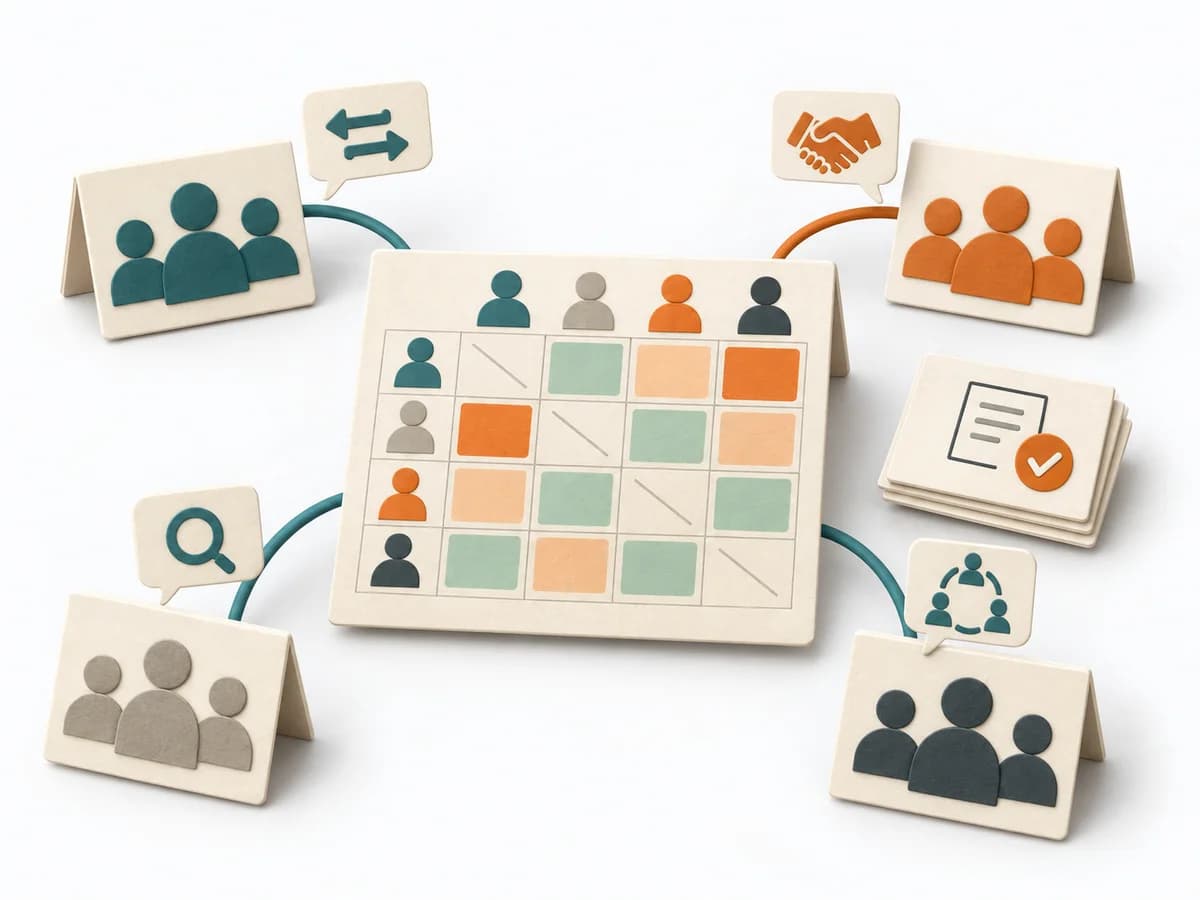 Team Design Team Topologies Interaction Modes |  Facilitation Expectation Mapping |
|---|---|---|---|---|
Purposedifferent | A Strategy Map translates strategy into a few connected objectives across perspectives such as finance, customers, processes, and learning. This makes visible which capabilities and activities are meant to drive which results. | When strategic direction needs to become measurable, it connects ambition with checkable results. It makes goals connectable to focus and review. | When several teams collaborate repeatedly, it describes the right interaction mode for each interface between them. It clarifies responsibility, interaction, and load between teams. The result is captured as an interaction heat map and pairwise agreements. | When roles, interfaces, or projects fail because of differing expectations, Expectation Mapping surfaces these differences. It shows what each side takes for granted and where the pictures diverge. |
Complexitydifferent | Medium | Medium | Medium | Low |
Timedifferent | 2-4 h workshop plus review | 1-2 h Setup | Half day | 45-90 min |
Participantsdifferent | 4-10 | 2-20 | Team-Leads plus Architecture | 3-12 |
Formatdifferent | Workshop | Workshop + async | Workshop | Workshop |
Outputdifferent | Strategy Map, Objective Set, Cause-Effect Hypotheses | OKR set, Measurement plan, Review cadence | Interaction Heat Map, Agreements per Pair | Expectation Map, Alignment Notes, Agreements |
Tags1 shared | AlignmentExecutionGoalsCausality | GoalsAlignmentOutcomesMeasurement | TeamAlignmentCollaborationOrganization | AlignmentStakeholdersTeam |