View methods side by side.
Choose up to four methods. Add them using the search and share the comparison by copying its link.
| Criterion | 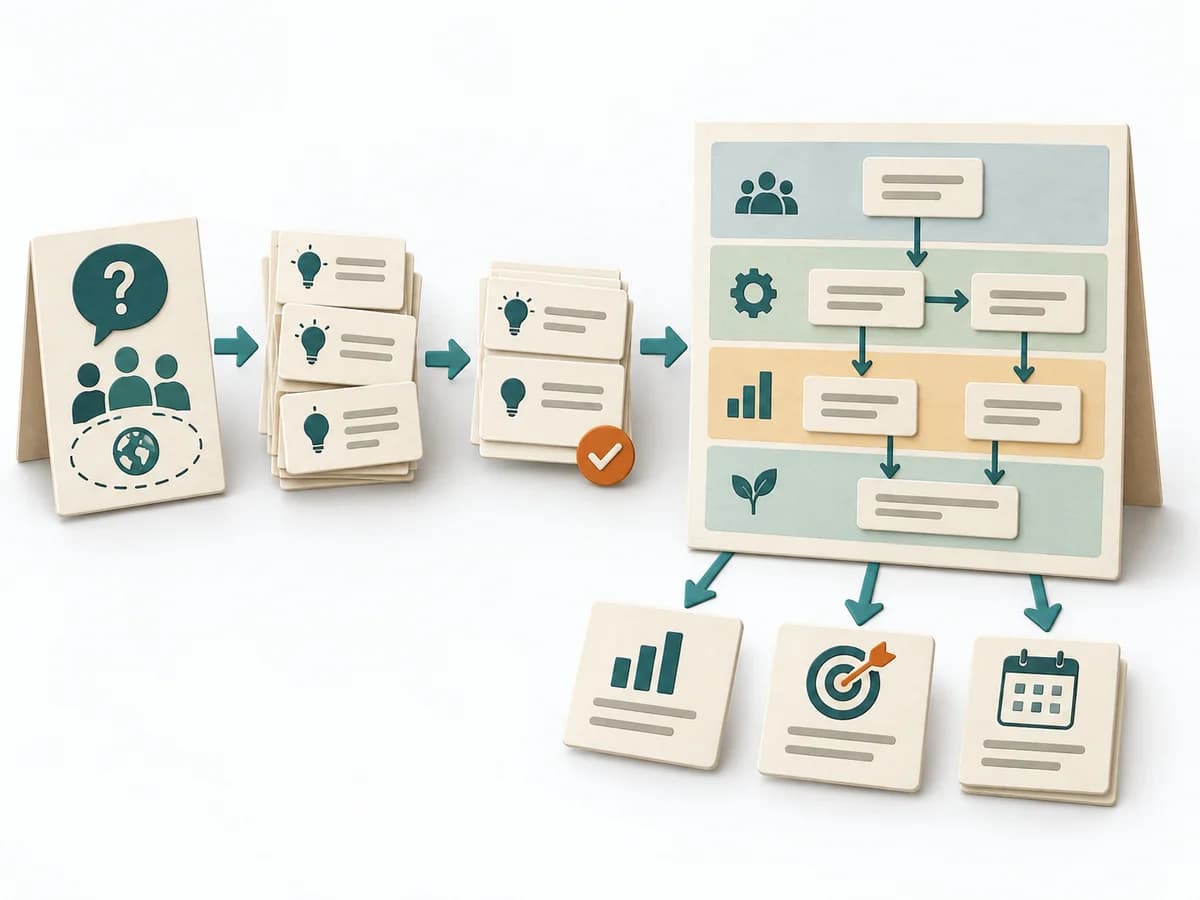 Business Strategy Strategy Map | 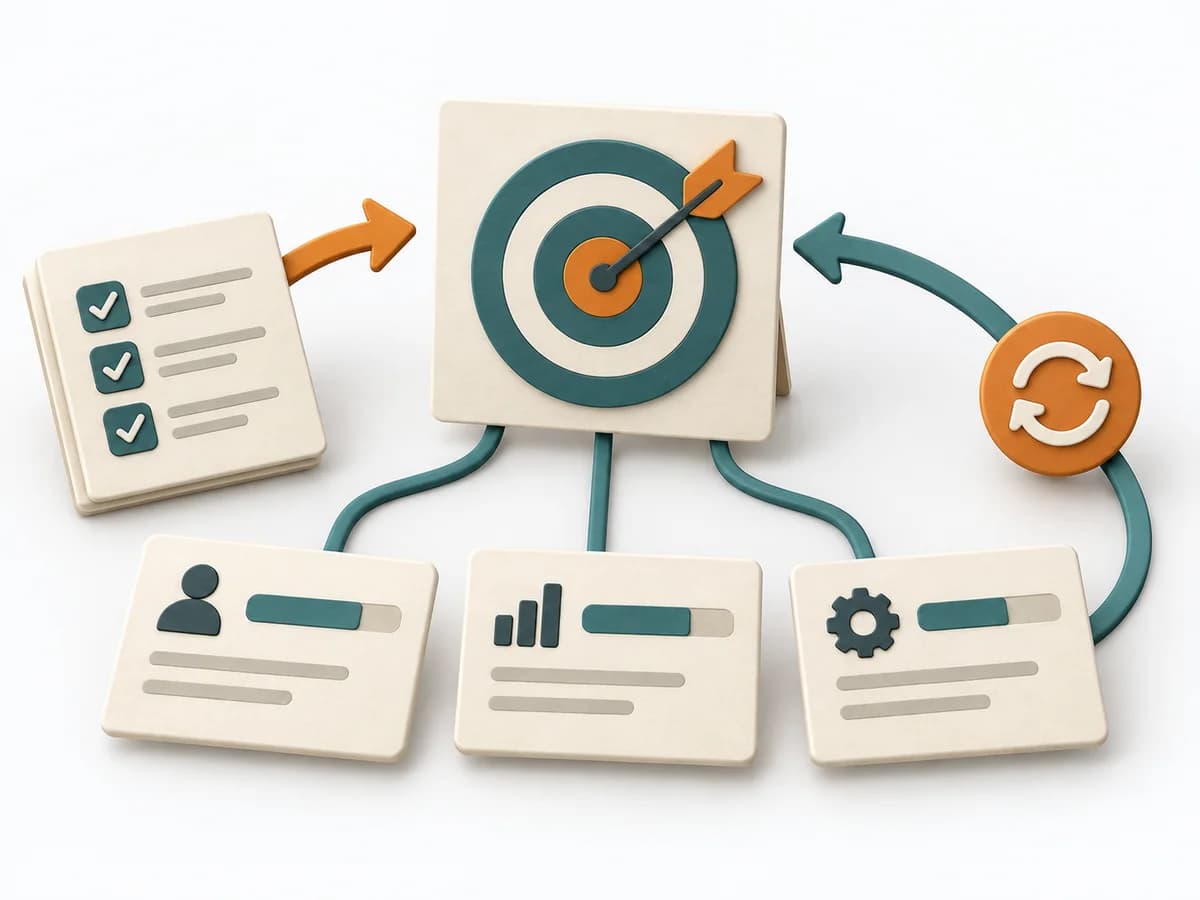 Product Strategy OKRs | 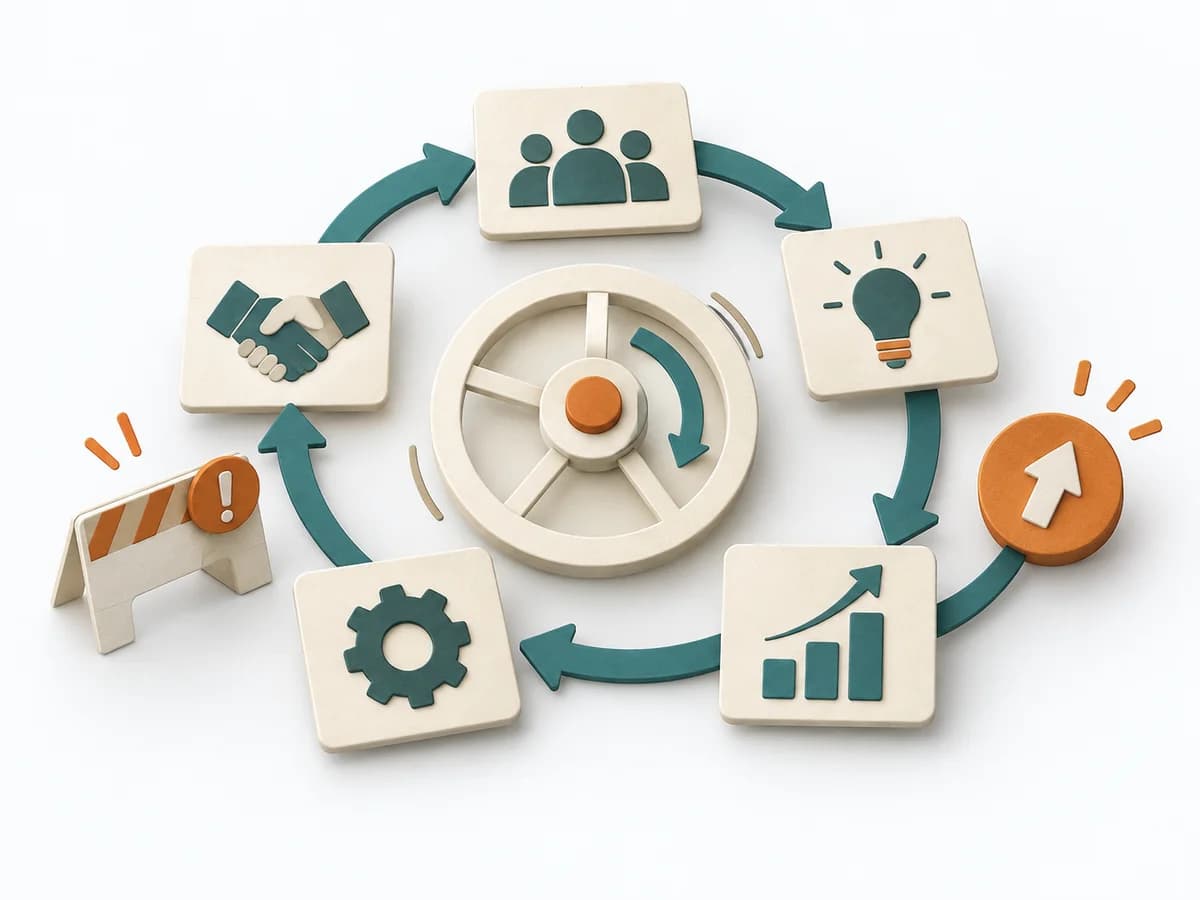 Growth Flywheel | 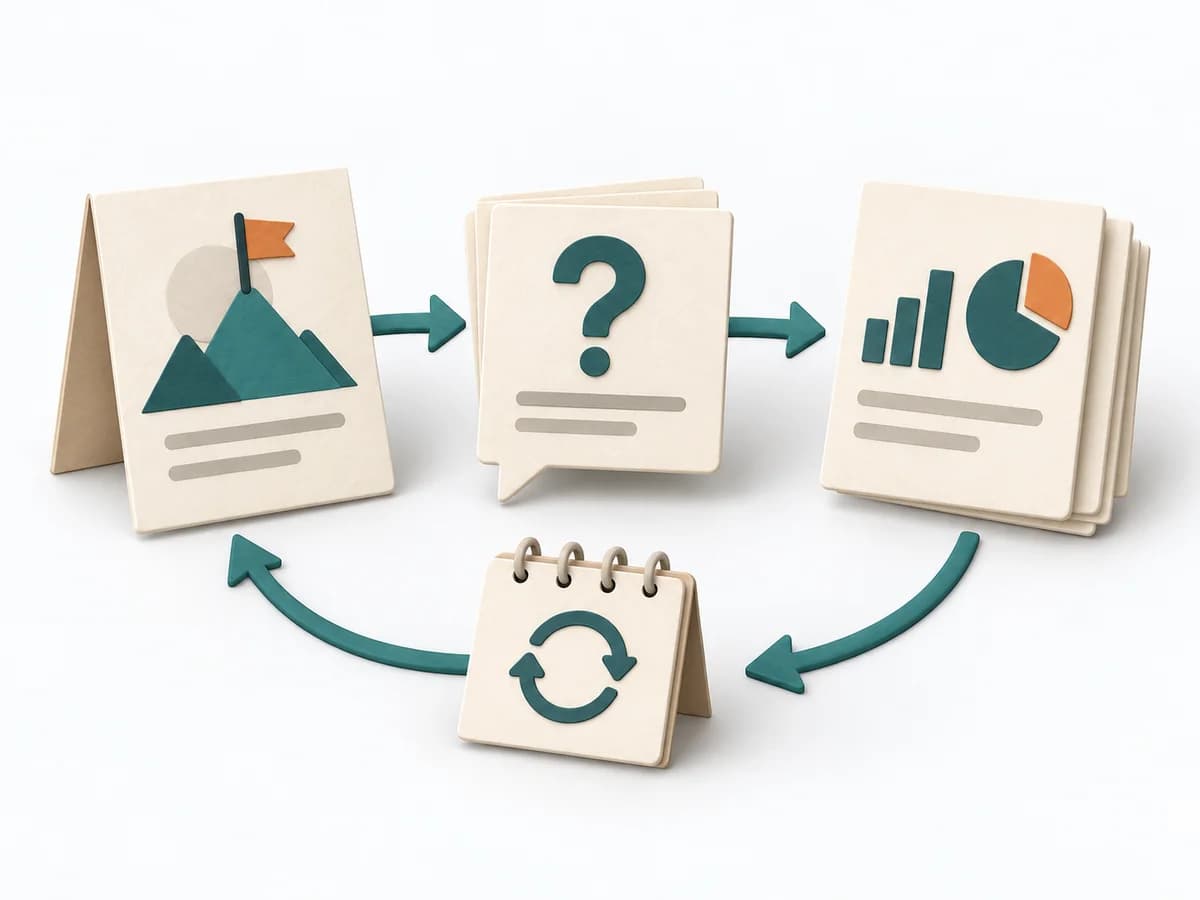 Engineering Goal Question Metric |
|---|---|---|---|---|
Purposedifferent | A Strategy Map translates strategy into a few connected objectives across perspectives such as finance, customers, processes, and learning. This makes visible which capabilities and activities are meant to drive which results. | When strategic direction needs to become measurable, it connects ambition with checkable results. It makes goals connectable to focus and review. | Growth often breaks down where a reinforcing mechanism builds up too much friction. A Flywheel shows the cycle of value, repetition, and reinforcement meant to sustain growth. | Helps clarify technical problems, hypotheses, and next steps in concrete terms. It breaks a technical problem into testable parts. The result is captured as a GQM table and metric briefs. |
Complexitysame | Medium | Medium | Medium | Medium |
Timedifferent | 2-4 h workshop plus review | 1-2 h Setup | 60-120 min | 90-180 min |
Participantsdifferent | 4-10 | 2-20 | 3-8 | 3-6 |
Formatdifferent | Workshop | Workshop + async | Workshop | Workshop |
Outputdifferent | Strategy Map, Objective Set, Cause-Effect Hypotheses | OKR set, Measurement plan, Review cadence | Flywheel Map, Friction Points, Growth Levers, Experiment Backlog | GQM Table, Metric Profiles |
Tagsno overlap | AlignmentExecutionGoalsCausality | GoalsAlignmentOutcomesMeasurement | GrowthRetentionConversion | MetricsMeasurementEngineeringAlignment |