View methods side by side.
Choose up to four methods. Add them using the search and share the comparison by copying its link.
| Criterion | 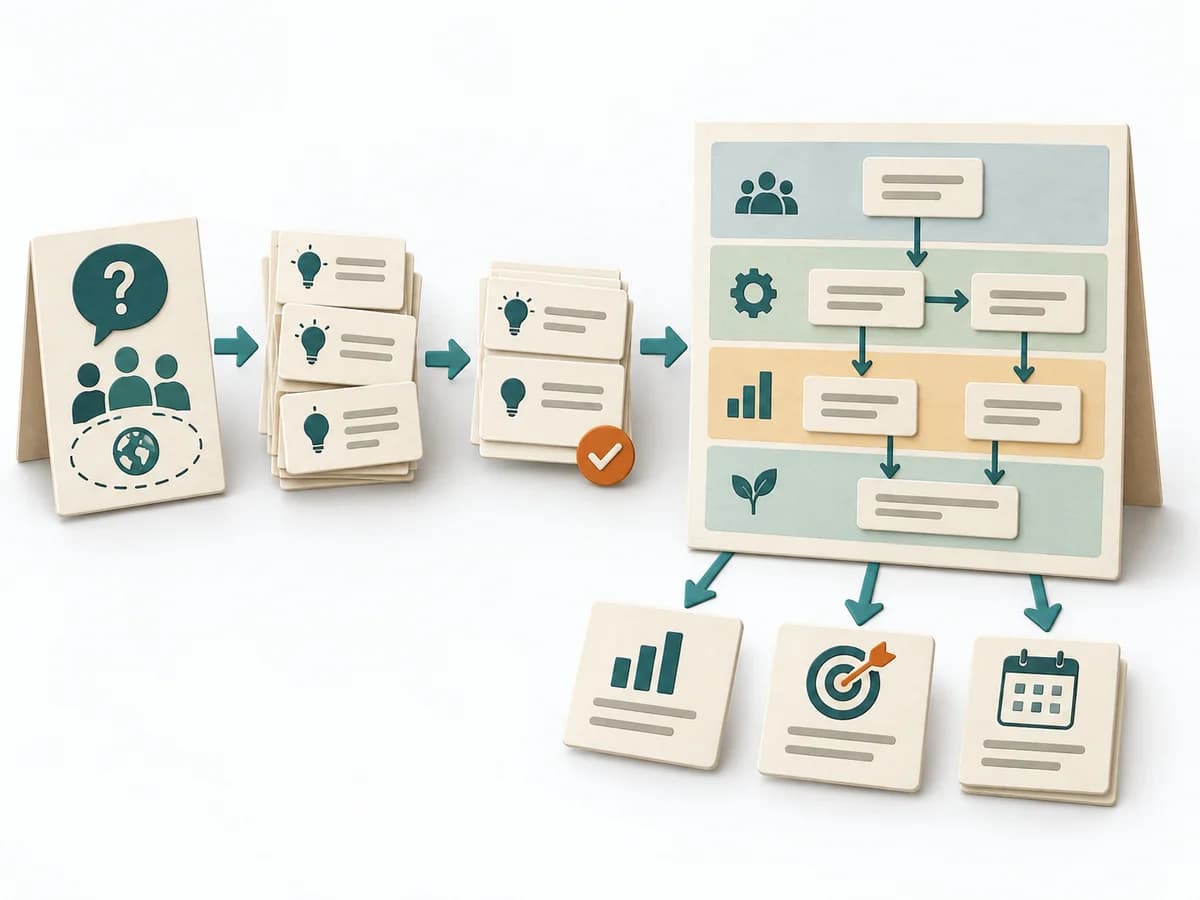 Business Strategy Strategy Map |  Facilitation Expectation Mapping | 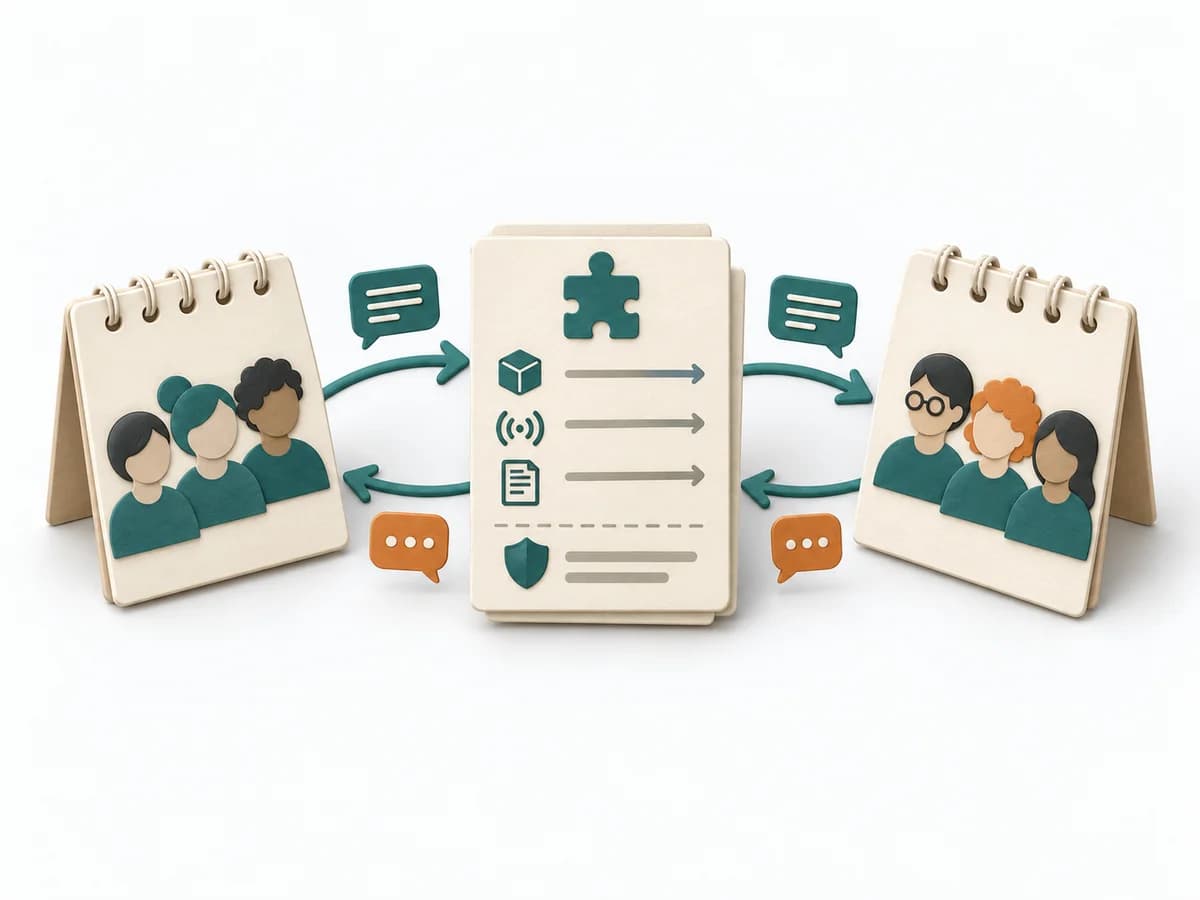 Team Design Team API | 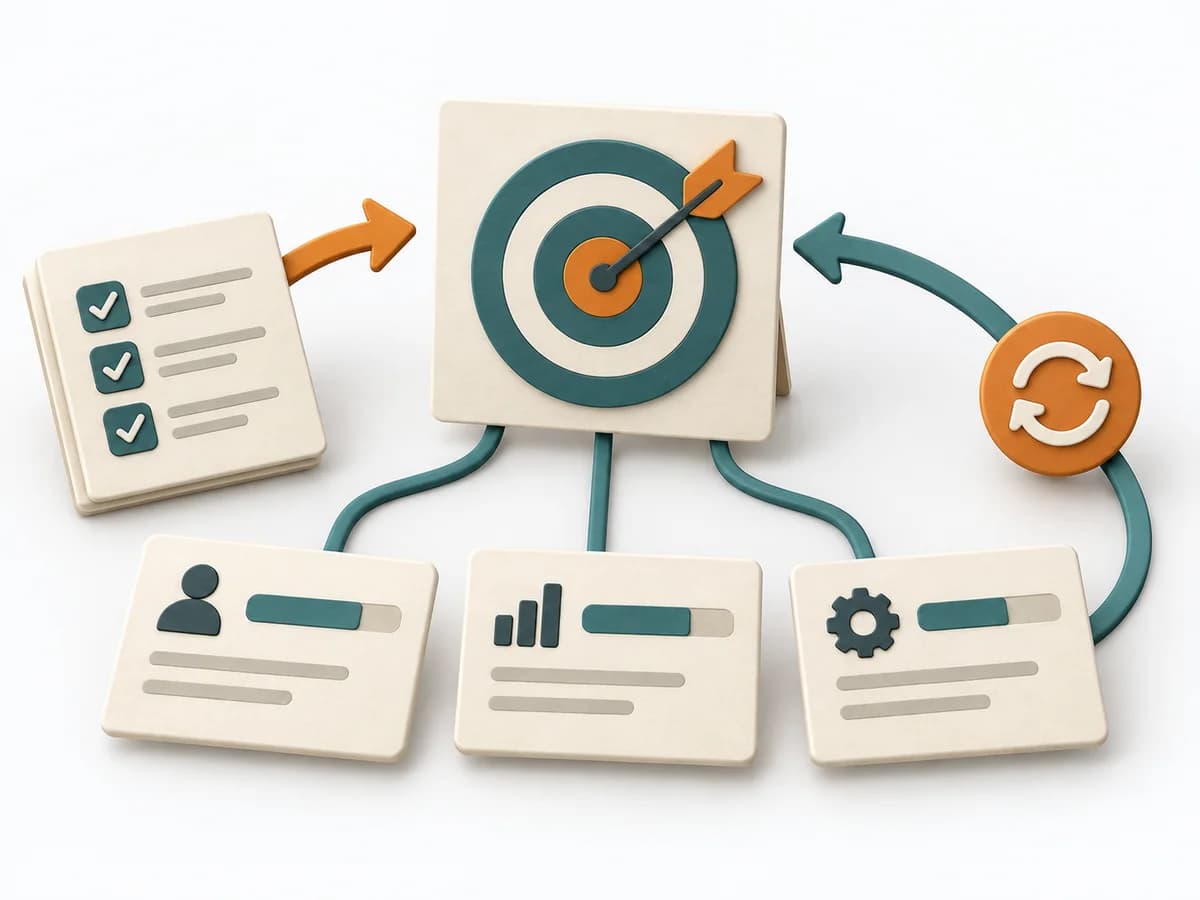 Product Strategy OKRs |
|---|---|---|---|---|
Purposedifferent | A Strategy Map translates strategy into a few connected objectives across perspectives such as finance, customers, processes, and learning. This makes visible which capabilities and activities are meant to drive which results. | When roles, interfaces, or projects fail because of differing expectations, Expectation Mapping surfaces these differences. It shows what each side takes for granted and where the pictures diverge. | When expectations between teams stay fuzzy, it describes how a team can be reached, used, and held accountable. It clarifies responsibility, interaction, and load between teams. The result is captured as a Team API document. | When strategic direction needs to become measurable, it connects ambition with checkable results. It makes goals connectable to focus and review. |
Complexitydifferent | Medium | Low | Low | Medium |
Timedifferent | 2-4 h workshop plus review | 45-90 min | Half day initial, dann laufend | 1-2 h Setup |
Participantsdifferent | 4-10 | 3-12 | Ein Team plus Stakeholder | 2-20 |
Formatdifferent | Workshop | Workshop | Workshop + async | Workshop + async |
Outputdifferent | Strategy Map, Objective Set, Cause-Effect Hypotheses | Expectation Map, Alignment Notes, Agreements | Team API Document | OKR set, Measurement plan, Review cadence |
Tags1 shared | AlignmentExecutionGoalsCausality | AlignmentStakeholdersTeam | TeamAlignmentCommunicationService | GoalsAlignmentOutcomesMeasurement |